Predicting the Rebalancing Needs for CitiBike in NYC
By Daniel Choy Dec 2020
GitHub
Introduction
In May 2013, New York City launched CitiBike, one of the largest bike-share systems in the United States. Today, CitiBike in NYC consists of more than 1200 + active dock stations that have expanded to Brooklyn, and Jersey City. As of September 2020, despite of COVID-19, there are more than 40,000 trips every day with a total of 113M total trips taken since it was first launched. Despite CitiBike's growth, the service is not always satisfactory. For example, the massive use of the service by commuter results into the quick depletion stalls in the dock stations in the morning and the rapid exhaustion of the available stalls in the docking stations in the afternoon so that users cannot deposit more bikes. This disparity highlights the importance of finding efficient ways to manage the bike-sharing network in NYC. An effective way to enhance the CitBike system is relocating bikes from overcrowded stations to those with a shortage of bikes, which is known as rebalancing. There are multiple ways to do this: One, CitiBike can deploy a fleet of trucks to pick up and drop off bikes at different stations to balance the network. Two, CitiBike can operate a bike train that carries 12-16 bikes to pick up and drop off bikes in narrow neighborhoods. Three, CitiBike can employ bike riders to move around bikes to improve the availability of bikes and docks. CitiBike is currently utilizing these methods (visit: CitiBike) for more information) in order to solve bike/dock station availability issues. However, CitiBike is still being criticized for its poor rebalancing strategy and management.
Objective
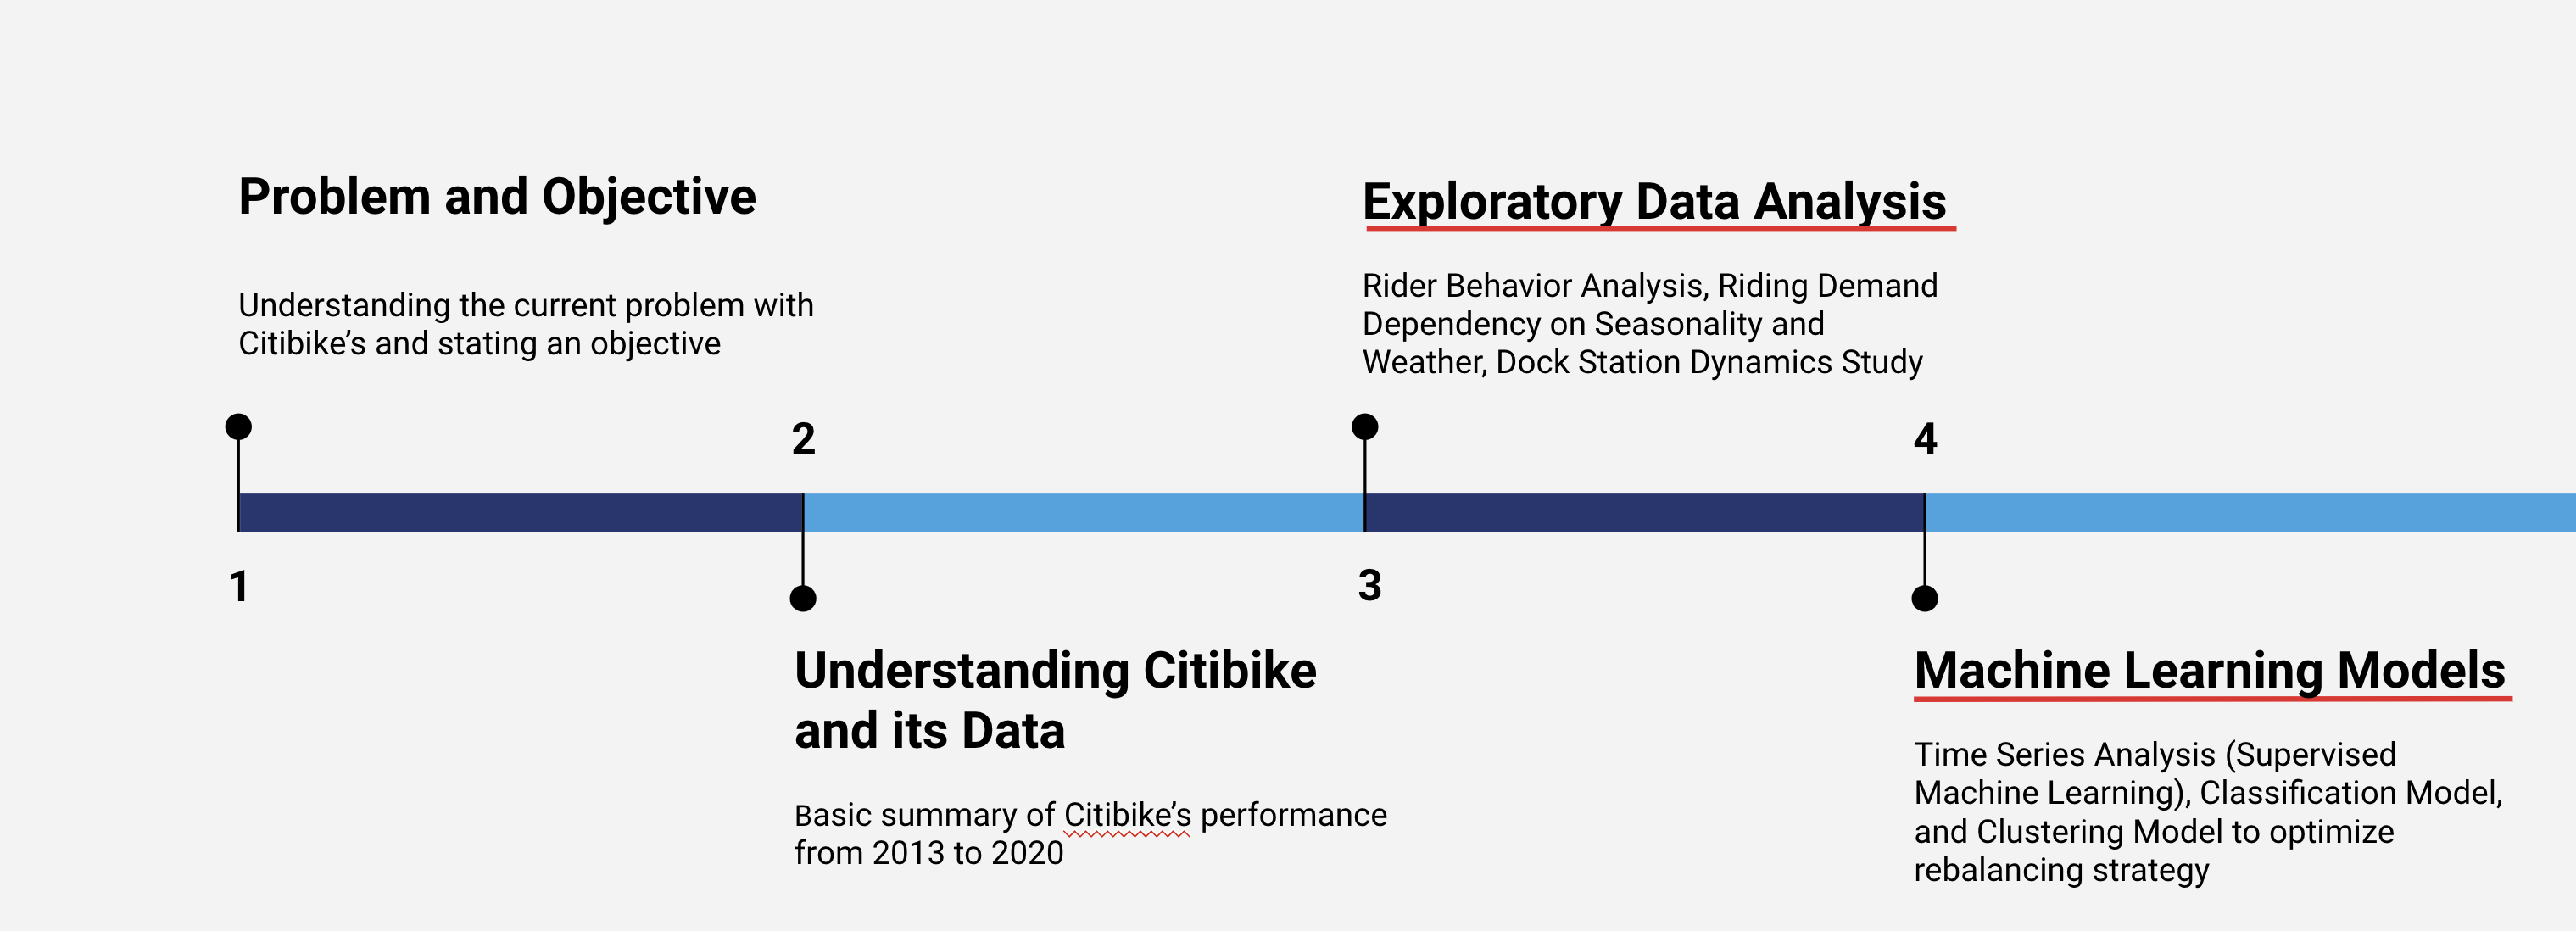
In order to improve the current CitiBike's rebalancing strategy, this project will address two topics: Understanding and Analyzing CitiBike's Riders data and inventory status and predicting the demand for bikes and stalls in the docking stations in different locations to relocate the bikes in order to best satisfy customer's demand.
Problem
Ever since CitiBike was introduced, the bike share system has been constantly criticized by its customers for its poor method of stock redistribution in order to equalize the supply of bikes and stations. The massive use of bike-share system during commuting time results into quick depletion of the stations in residential areas in the morning and the rapid depletion of the stations in commercial areas in the afternoon. These unsatisfactory feedback can be reflected on many of recent CitiBike-related tweets and articles. In addition, tourists disappointment can be reflected by the high rate of negative reviews of the service on TripAdvisor (for more information, visit: TripAdvisory)
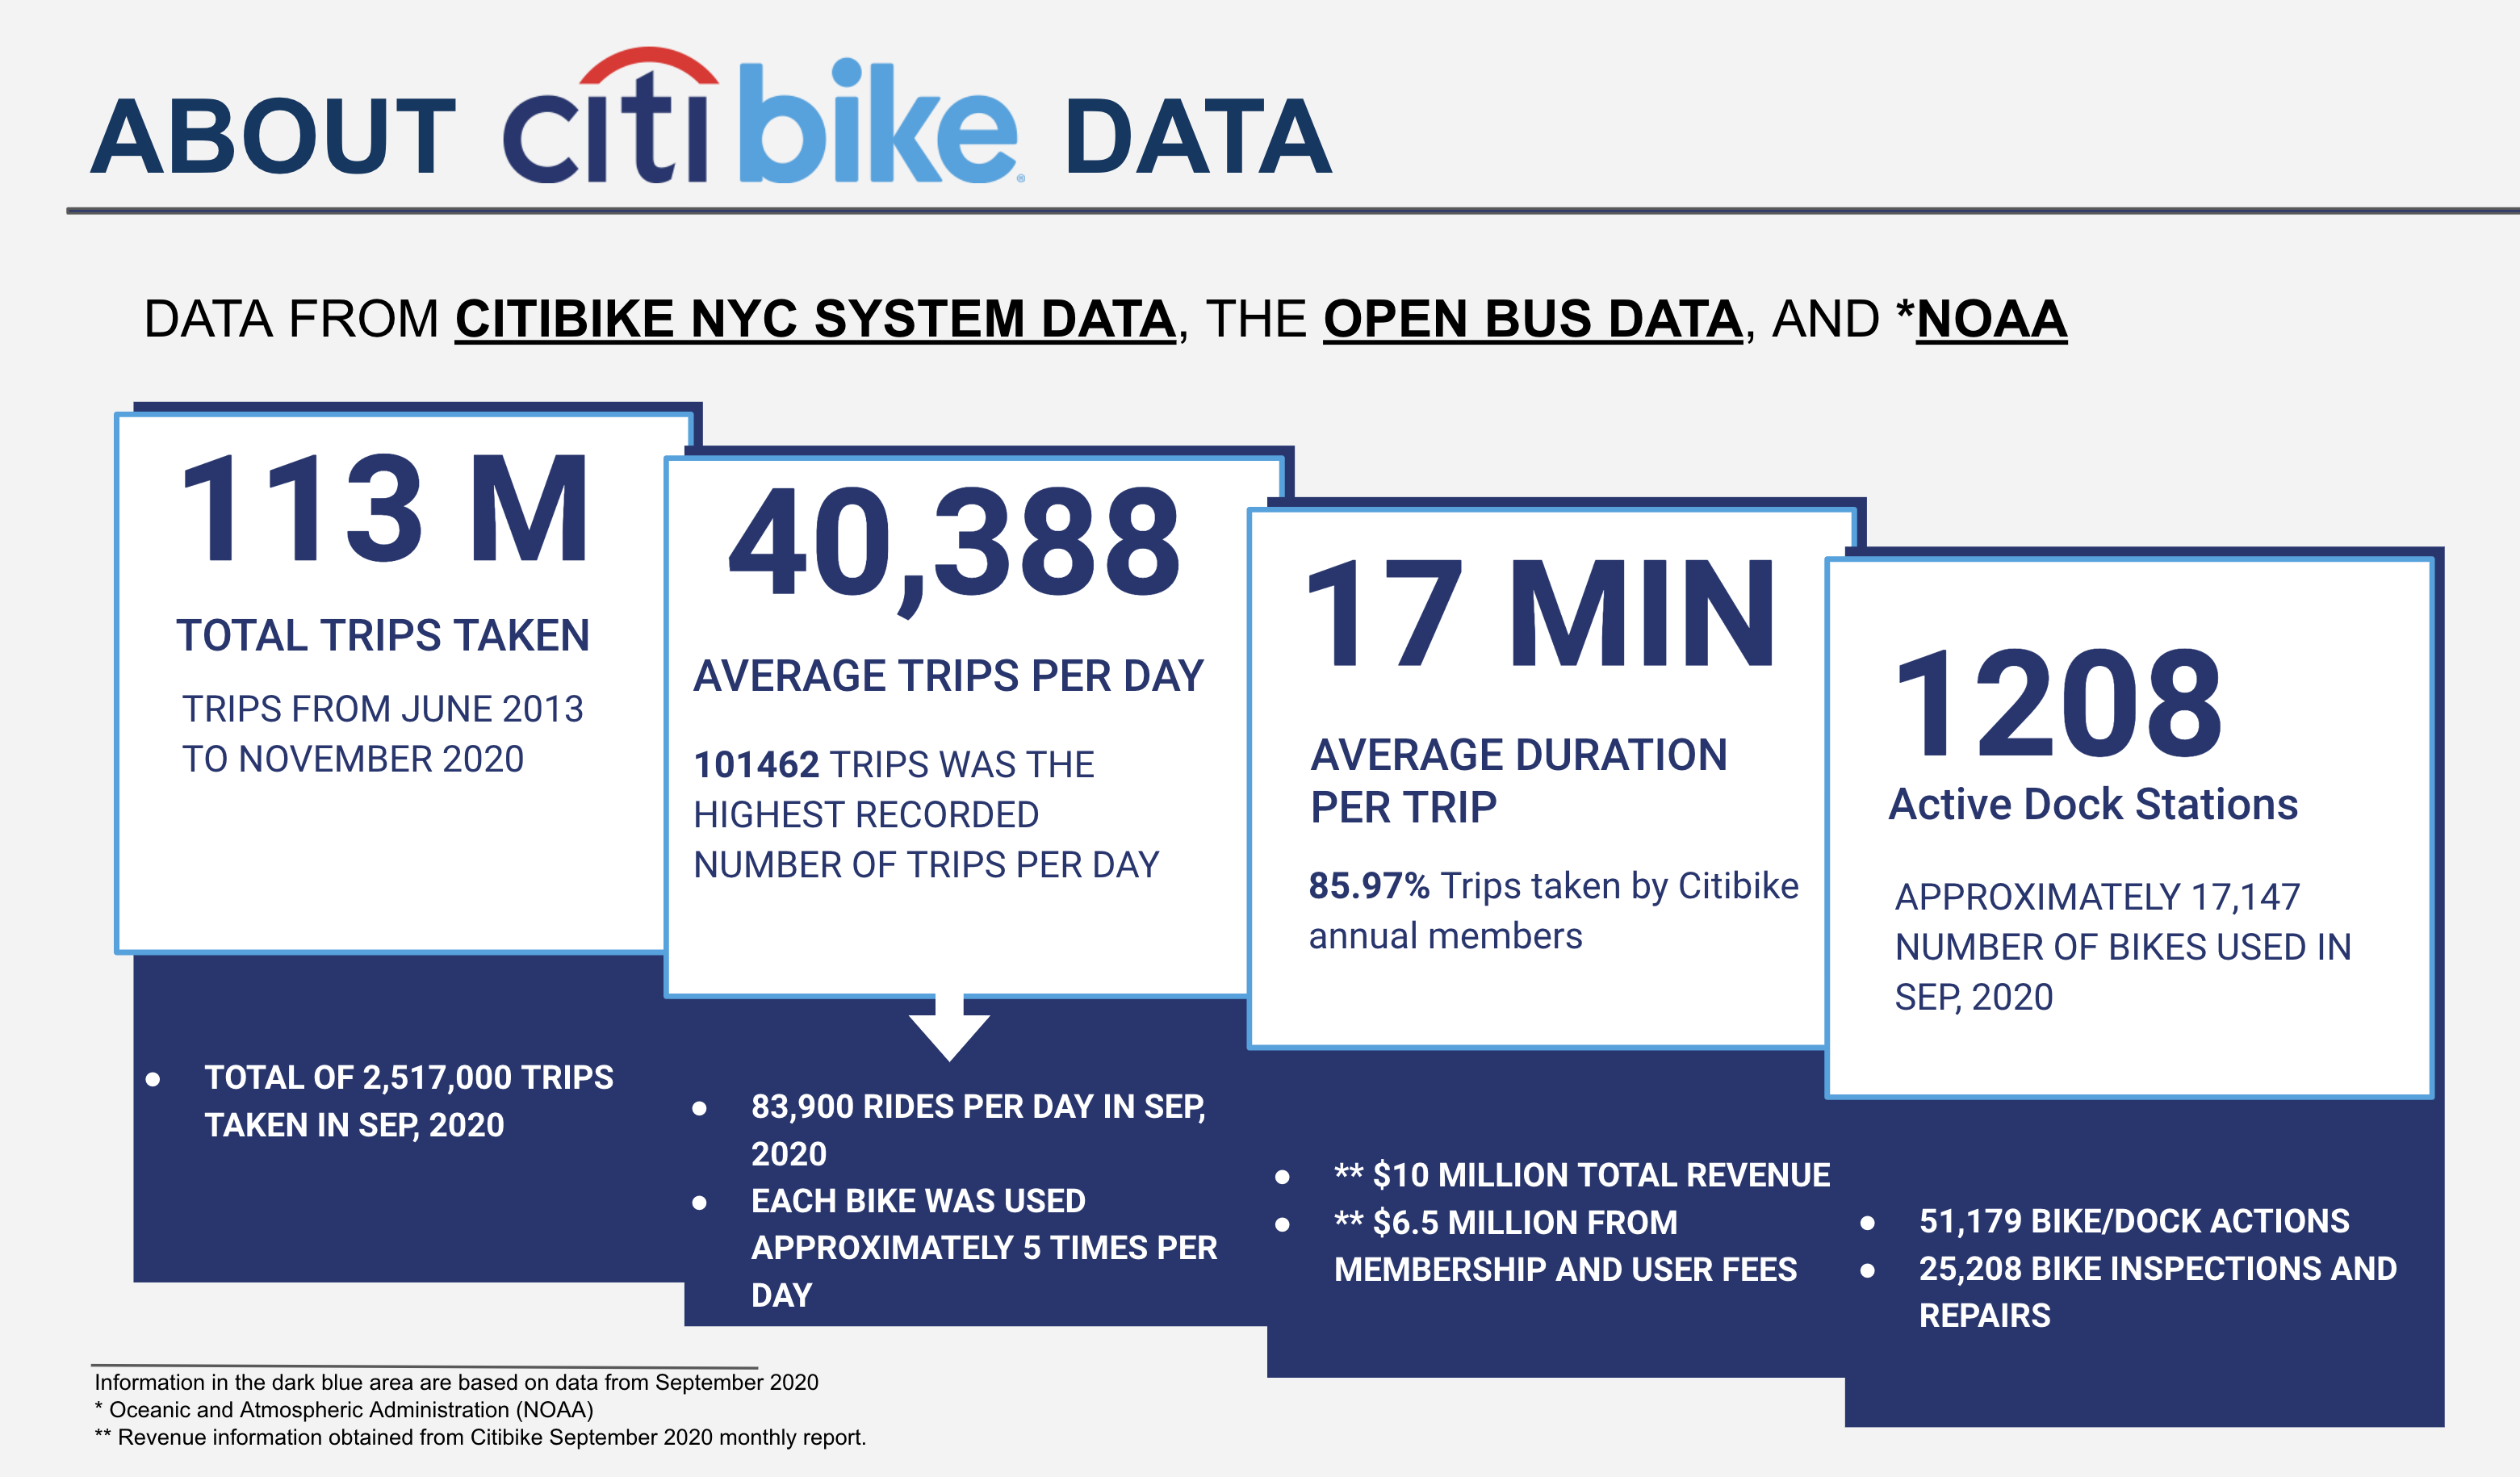
About the Data
For the scope of the project, our group used 3 different datasets: 1) CitiBike ridership data (2013 - 2020) from CitiBike NYC System; 2) CitiBike dock station-related data from Open Bus Data; 3) Weather data in NYC from NOAA or National Oceanic and Atmospheric Administration. We highlighted some of the basic summary statistics based on the information we had in the visualization below.
Exploratory Data Analysis
Ridership Analysis
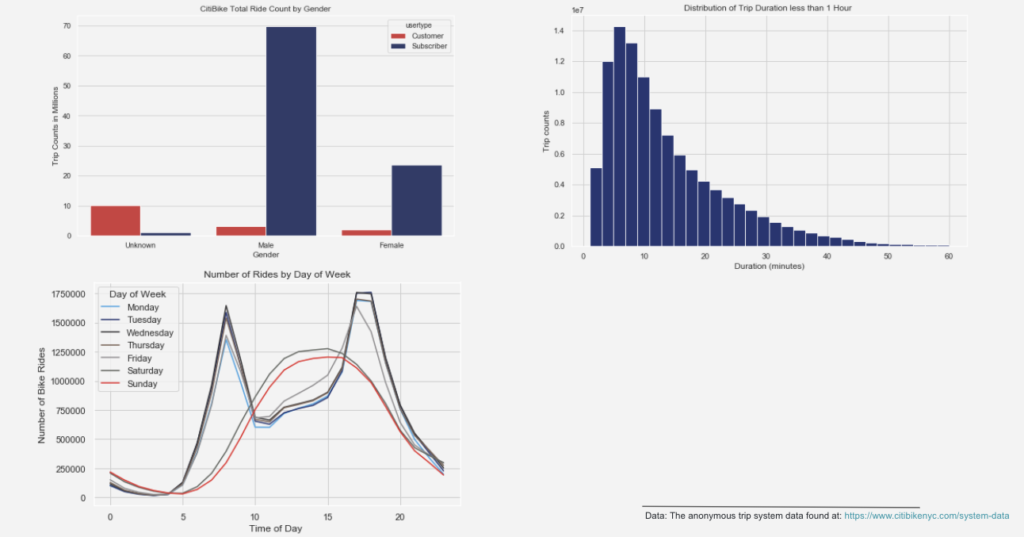
As can be seen, during the weekdays, ridership peaks on weekdays during the morning and afternoon rush hour periods, presumably used for commuting purpose. During the weekend, riders use CitiBike mostly during the afternoon. Another graph indicates that many of the CitiBike users are subscribers (customers with membership) mostly using CitiBike less than 20 minutes.
Insights from Dock Station Data
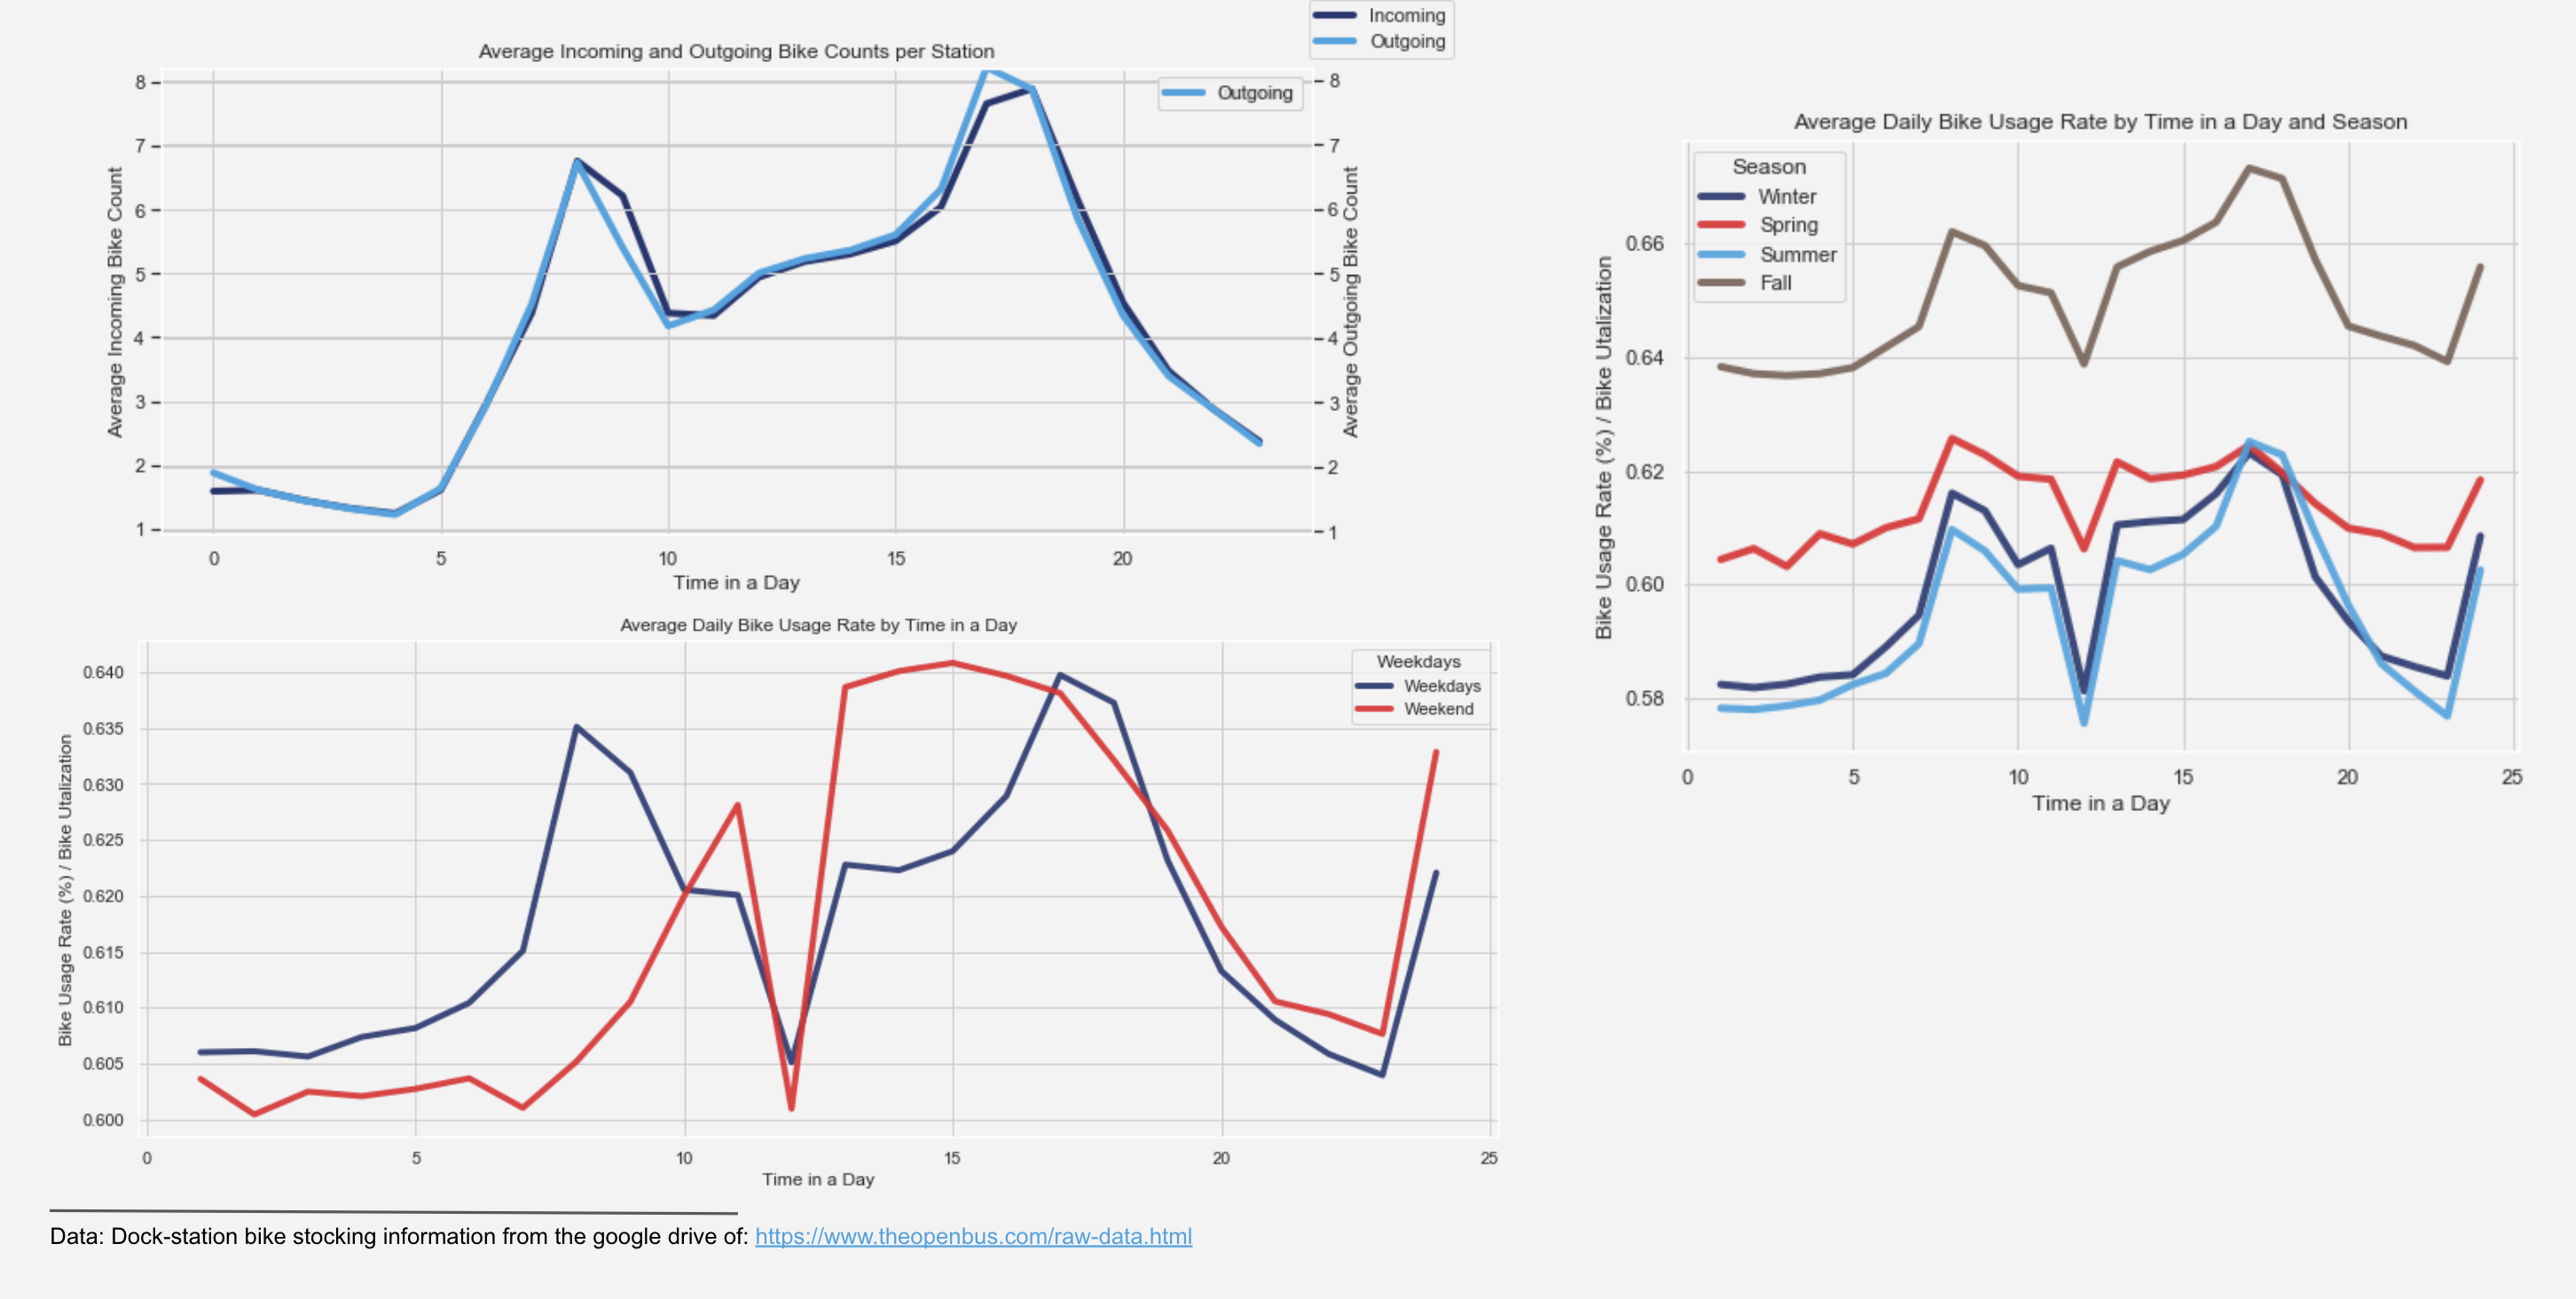
Based on the graph above, the incoming and outgoing bike flow in general matches up decently well as you can see the average flow that also reflects the peak commute time in the city. Bike usage rate above (or bike utilization rate) was calculated as available docks over total number of docks at each station. Bike utilization is high during rush hour when people commute and drops early afternoon. In other words, there are more available bikes from 11AM to 2PM. In terms of season, bike utilization rate is relatively higher in the Fall than any other season throughout the day.
Seasonality Analysis
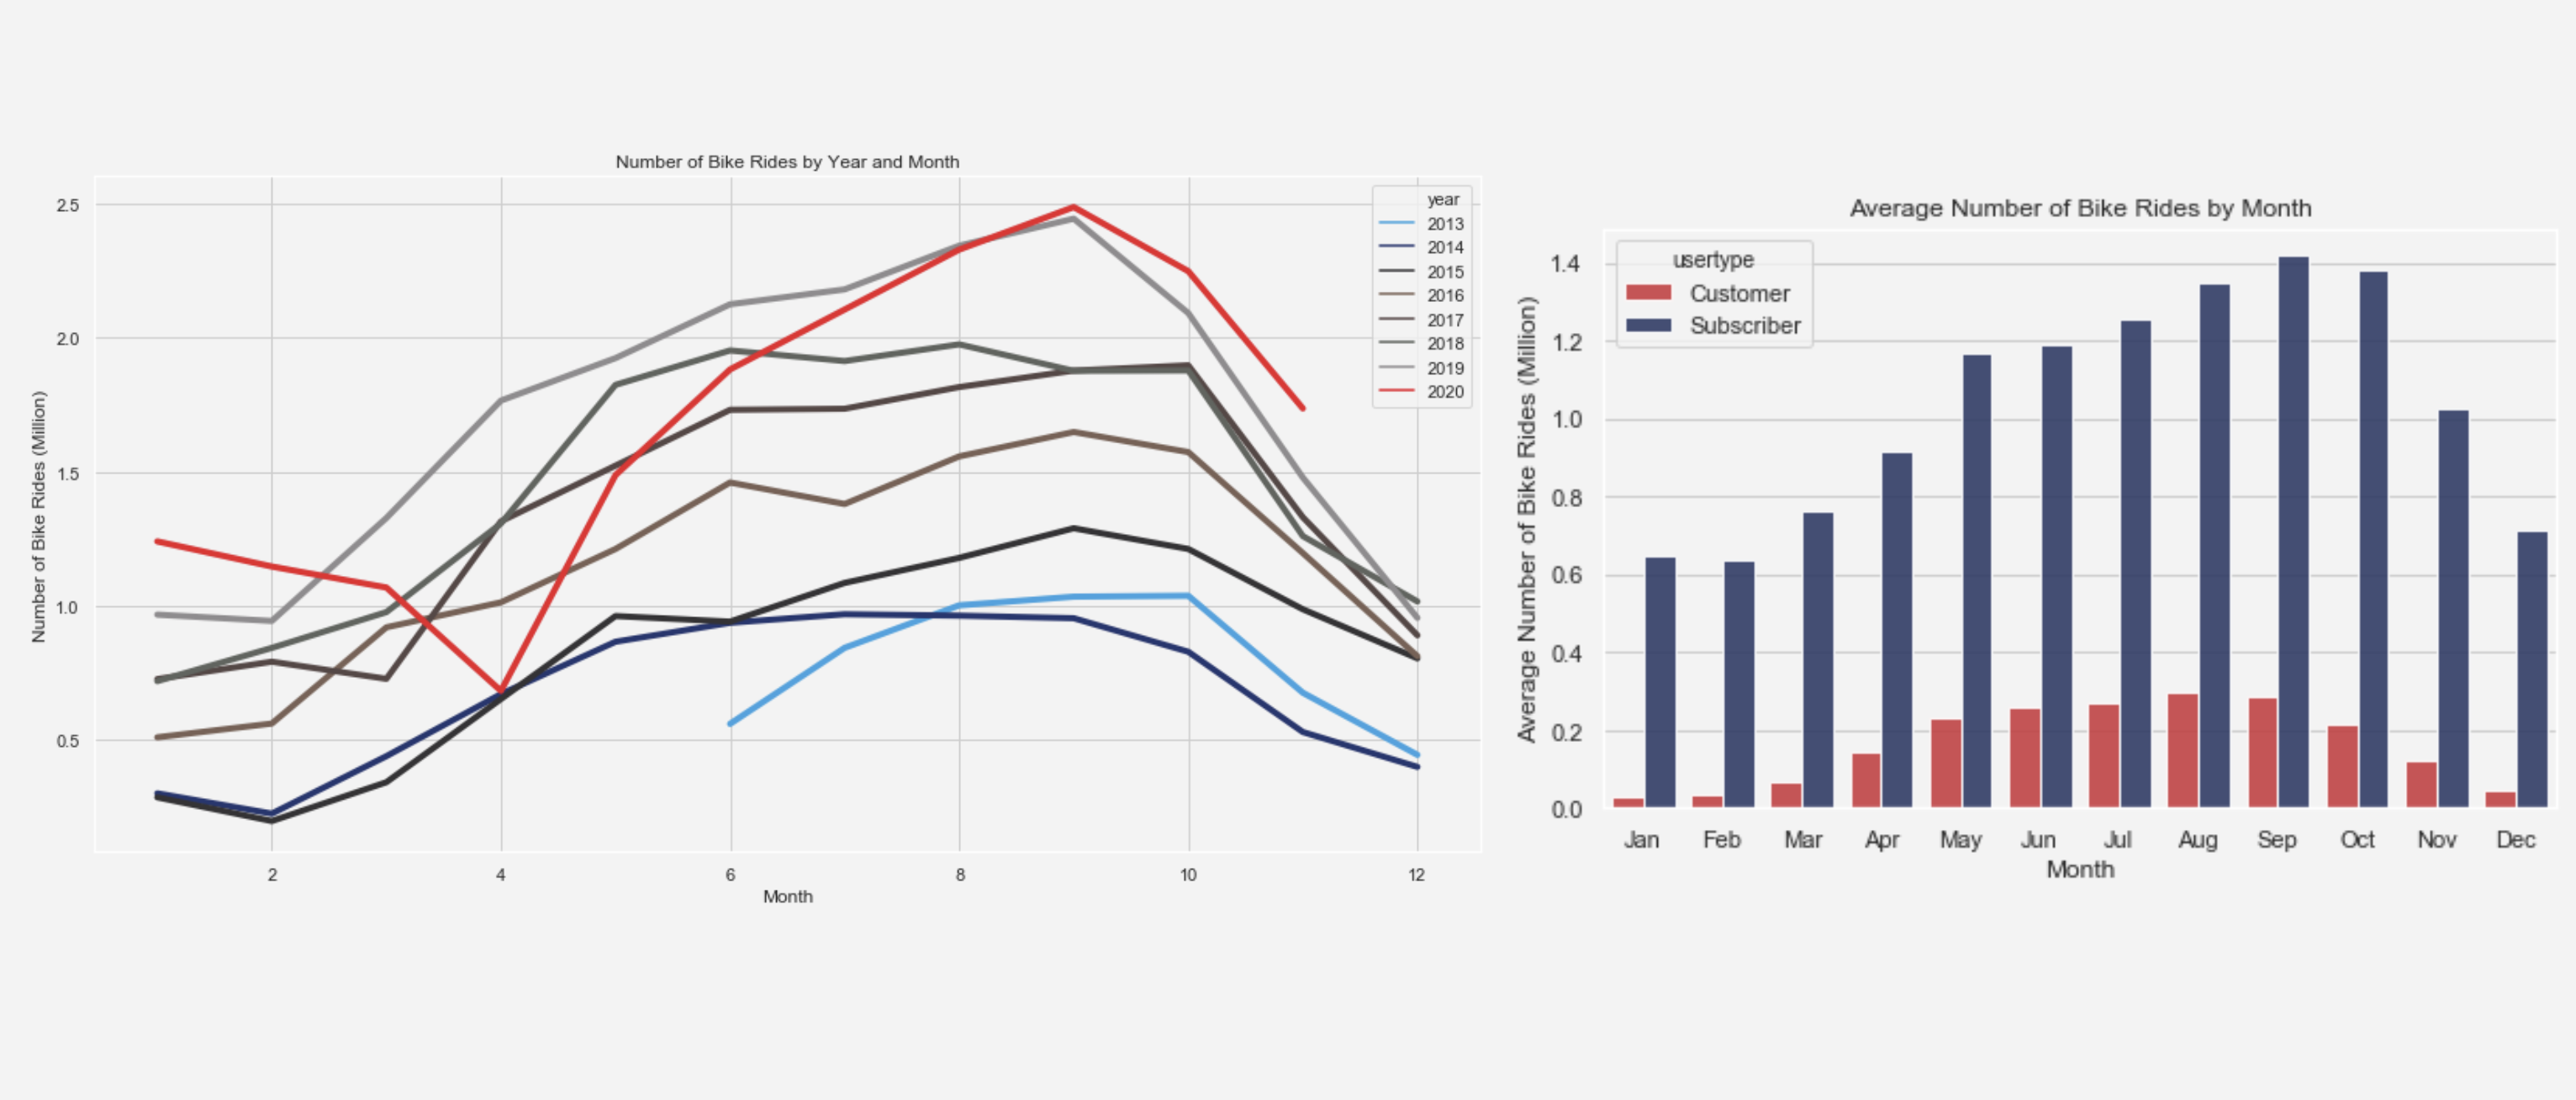
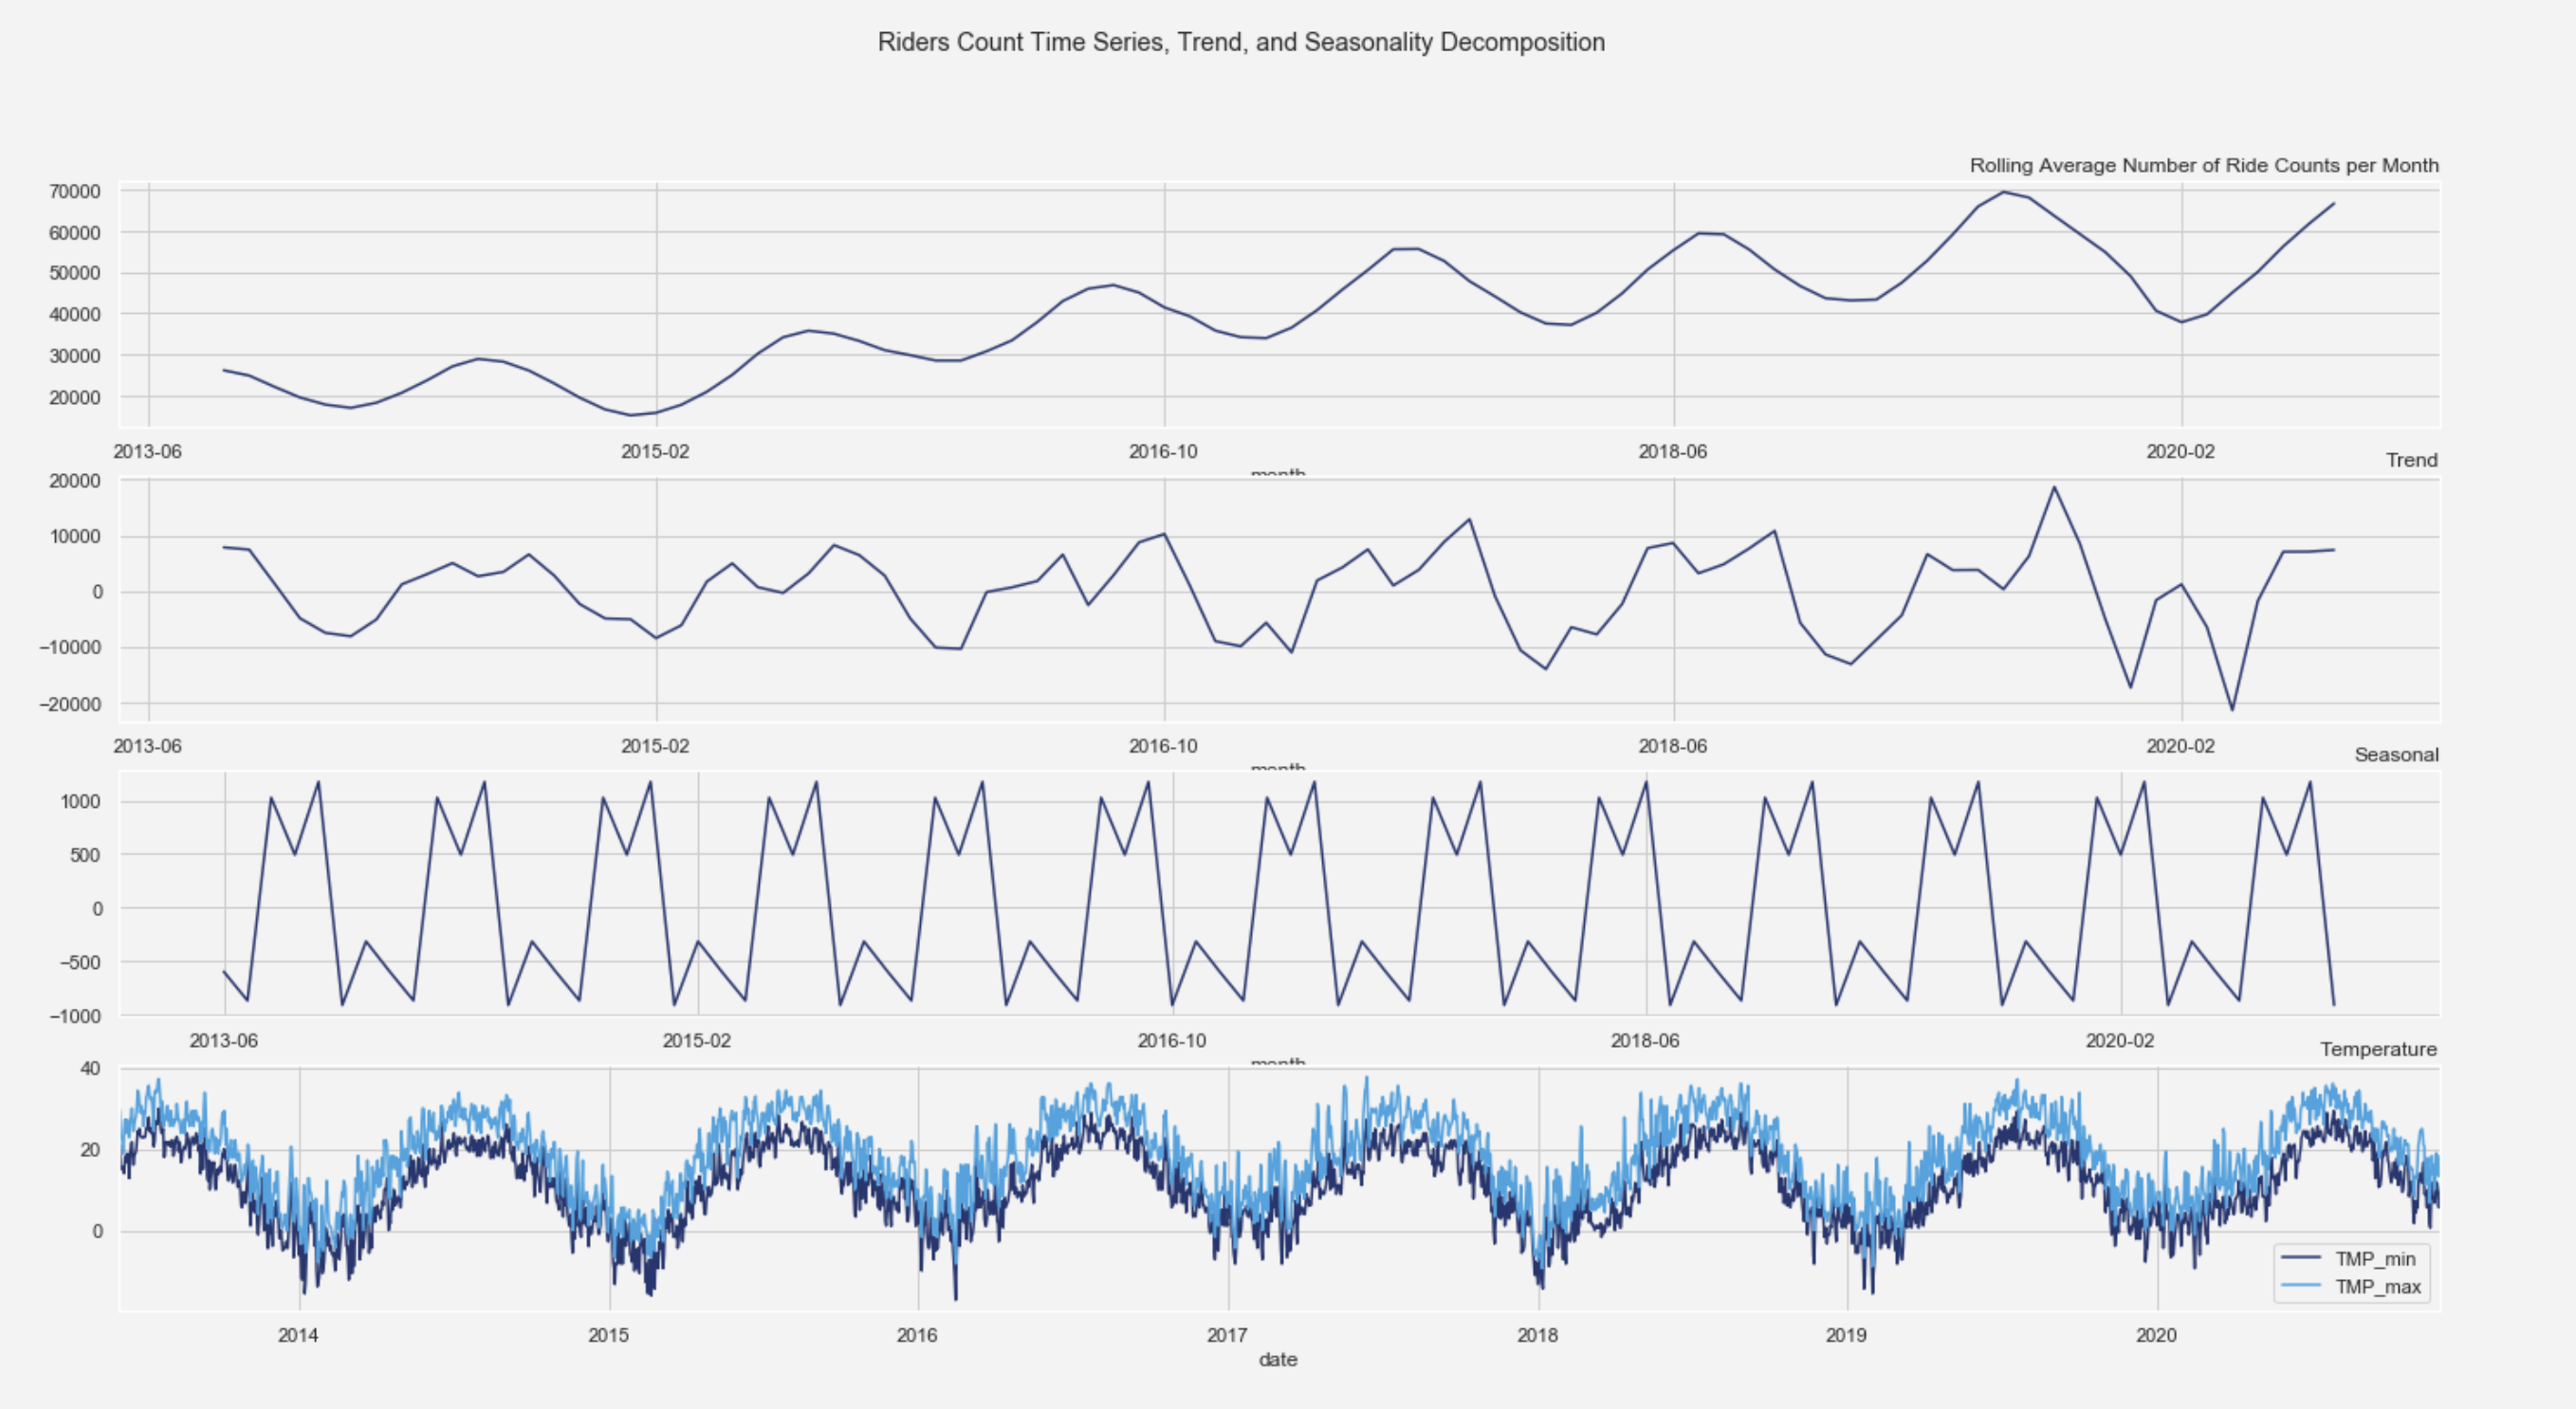
Next, we looked at the seasonality trends based on the rider’s data. If we look at the graph, the number of bike rides has been increasing throughout the years with the exception of early 2020. The drop in the number of rides in early 2020 can be explained by the COVID-19 effect. Luckily, in September, the number of bike rides surpassed its previous year. In terms of months, the number of rides drastically drops during winter and early spring time. Many of CitiBike users are annual subscribers and based on the graph, we can see that not a lot of normal customers are using CitiBike during the Winter, which presumably means that not a lot of tourists are using CitiBike during this time of the year.
Machine Learning
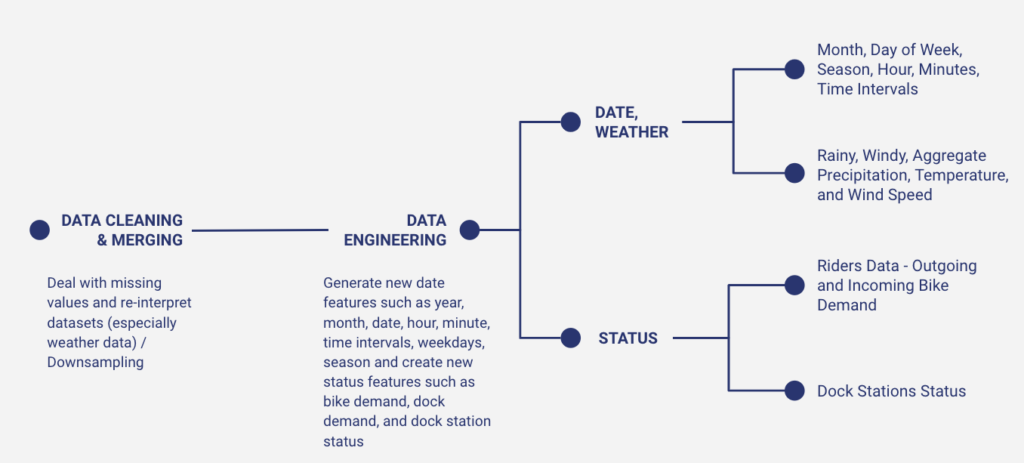
Prior to discussing about our models, we want to briefly go through the data processing and feature engineering process. For our data cleaning and data merging part, we dealt with missing values and re-interpreted some datasets, especially with the weather data, which NOAA had its own way of recording the temperature, precipitation, and wind speed. With the data engineering part, we generated new date features such as year, month, hour, season, minutes, time intervals, weekdays, lag features, and created new status features for both rider’s data and dock stations data.
K-means clustering
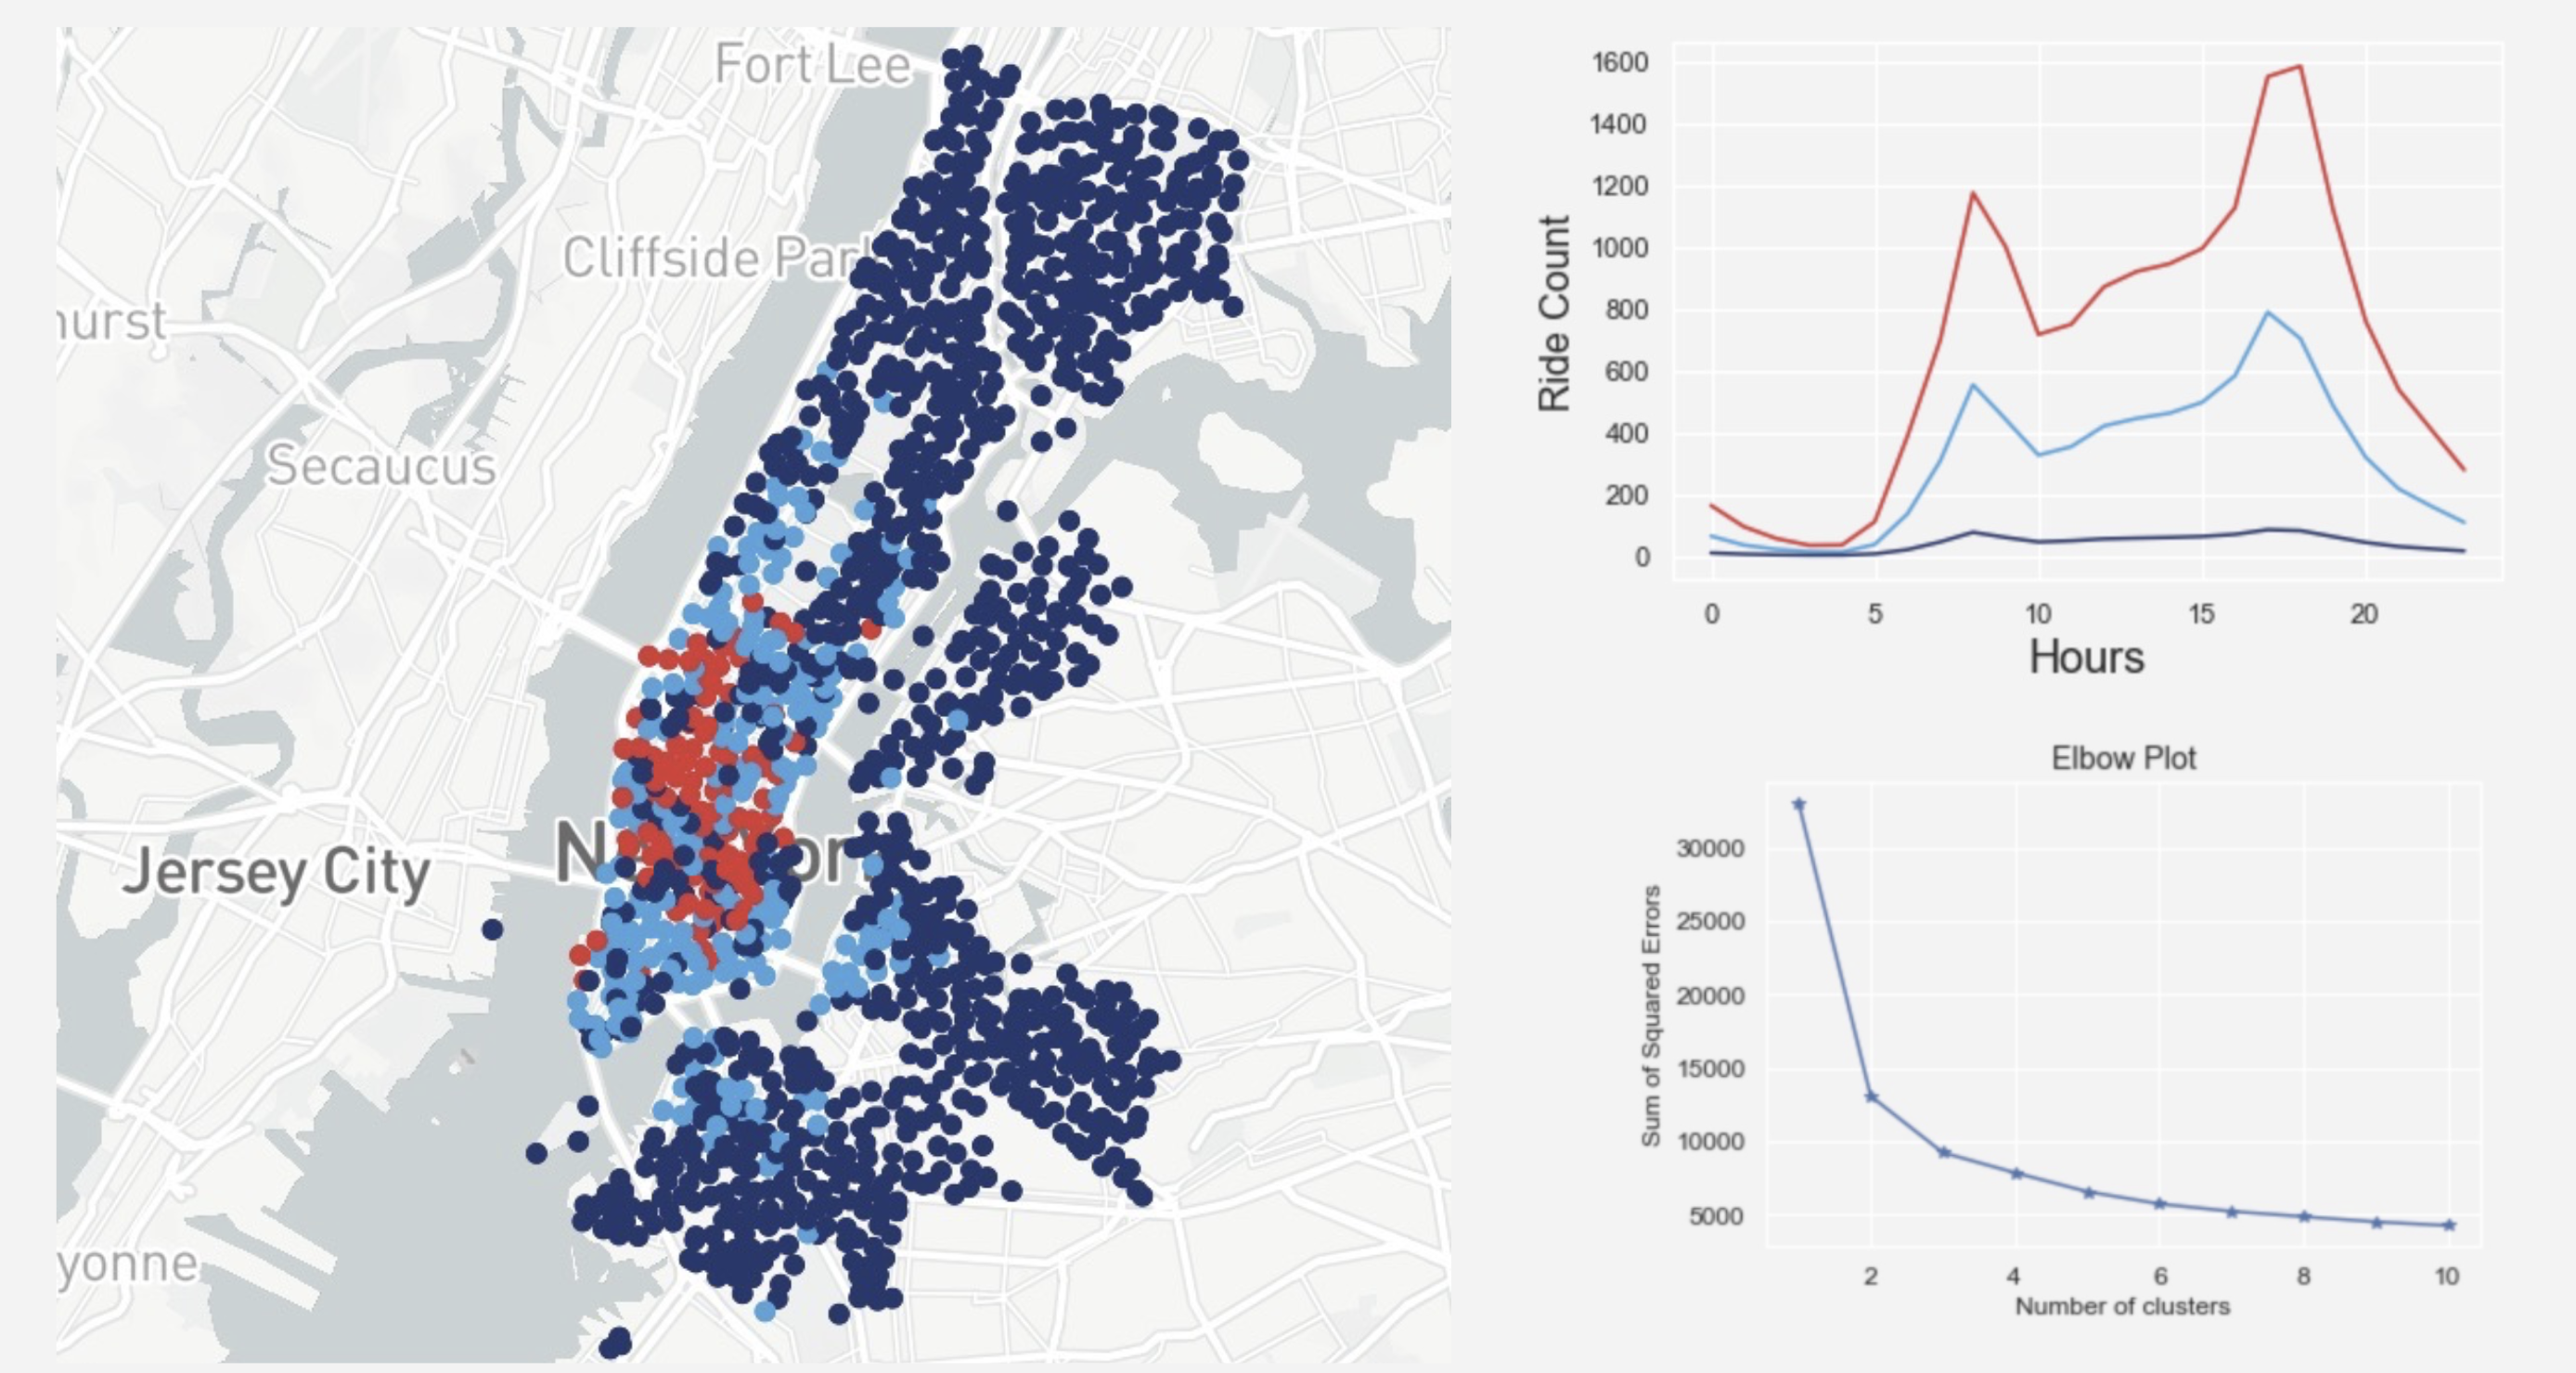
In order to identify patterns of CitiBike ridership, we used Hierarchical clustering and K means clustering with rider count information at every station at every hour of the day. The result of hierarchical clustering was not utilized in other analysis due to the fact that it does not yield clusterings that reflect the magnitude of the bike ride data. Therefore, K-means clustering was selected in place of hierarchical clustering as the input for other machine learning models.
The result of a three cluster K-means clustering is as follows: 1) There are three distinct groups, clustering stations by magnitude of rider count; 2) Group 0 has the lowest overall number of rider count, below average, relatively steady ride count with peak hours showing the lowest ridership, including all the stations furthest away from lower Manhattan; 3) Group 1 has a medium level of rider count (above average), but still less than group 2, scattered throughout Manhattan and Brooklyn; 3) Group 2 has the highest number of overall number of rider counts. The stations are mostly in the lower Manhattan area and has similar rider distribution as group 1, but at a bigger scale.
Random Forest Classification
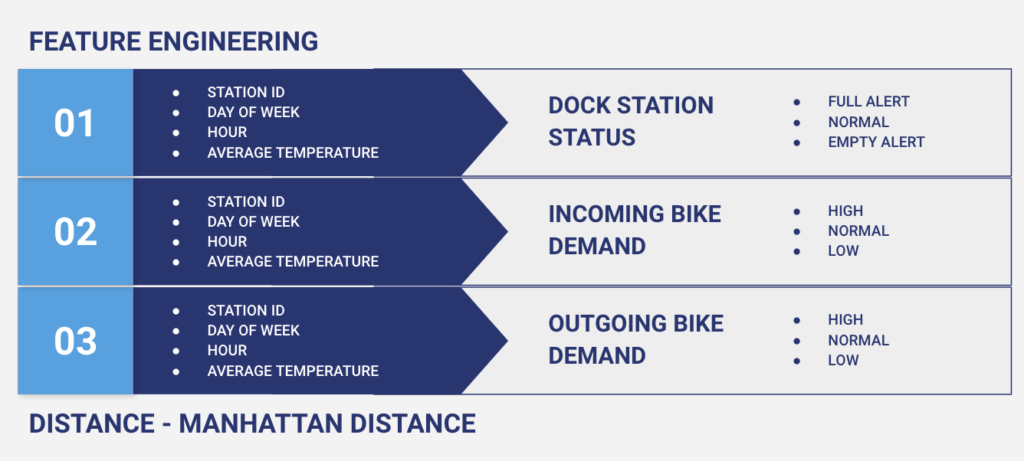
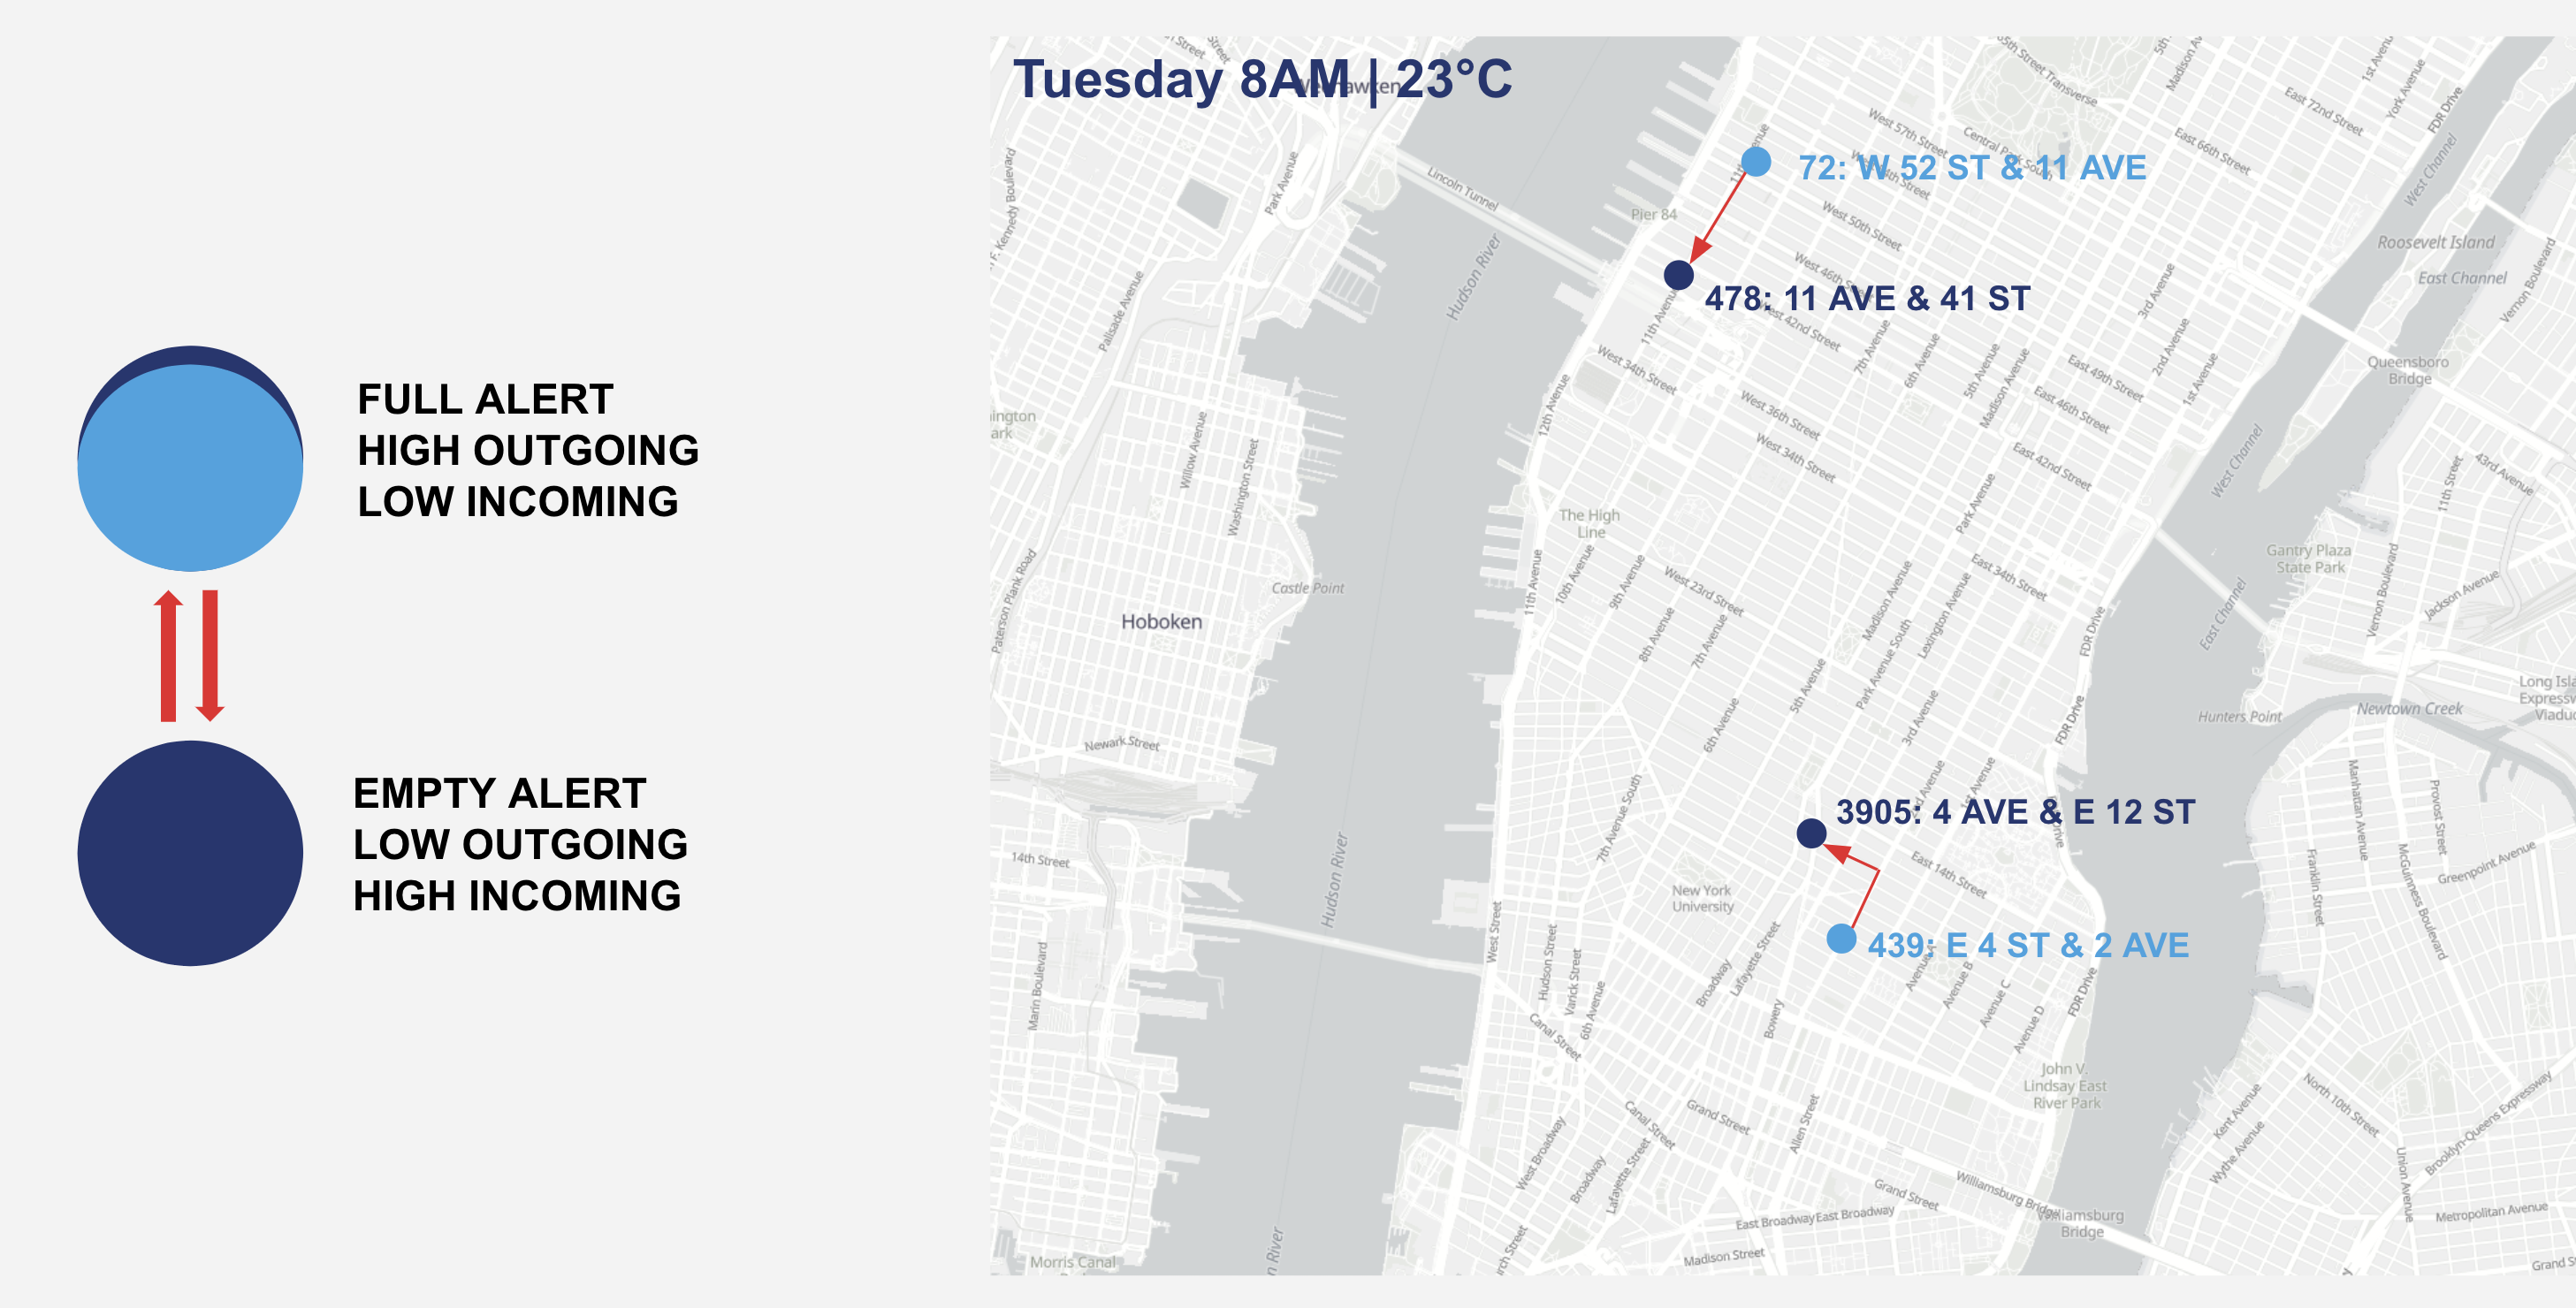
Once we finished preprocessing the data, we trained three random forest classification models on our processed data - 1) a model predicting dock station status; 2) a model predicting incoming bike demand; 3) a model predicting outgoing bike demand in order to create a rebalancing strategy based on each dock station’s status quo when provided a date, time, and weather in the future. We made sure to implement a train-test splitting to minimize overfitting on our training data, and tuned the models as best as we were bale to given our processing power. In addition, we had to generate new target variables. For the dock station data, we generated a dock station status variable which is classified into three different values: full alert, normal, and empty alert. When a dock station is in full alert status, it means that there are there are too many available bikes in a given dock station compared to its total number of docks (which is 75% of the total number of docks) and when a dock station is in empty alert, it means that there are very little available bikes compared to its total number of docks in a given dock station. For example, if dock station A had a total number of 20 docks, and had 16 available bikes, this dock station would be at a full alert. If the dock station had only 4 available bikes, it would be at an empty alert status. Else, the dock station would be healthy. Same with the incoming and outgoing bike demand, if there we too many bikes coming in or going out, it would be classified as high, and vice versa.
Once we had the models trained to supply predictions for dock station status, incoming bike demand, and outgoing bike demand for each station, we developed an iterative algorithm to identify which stations needed to be rebalanced out or rebalanced in.
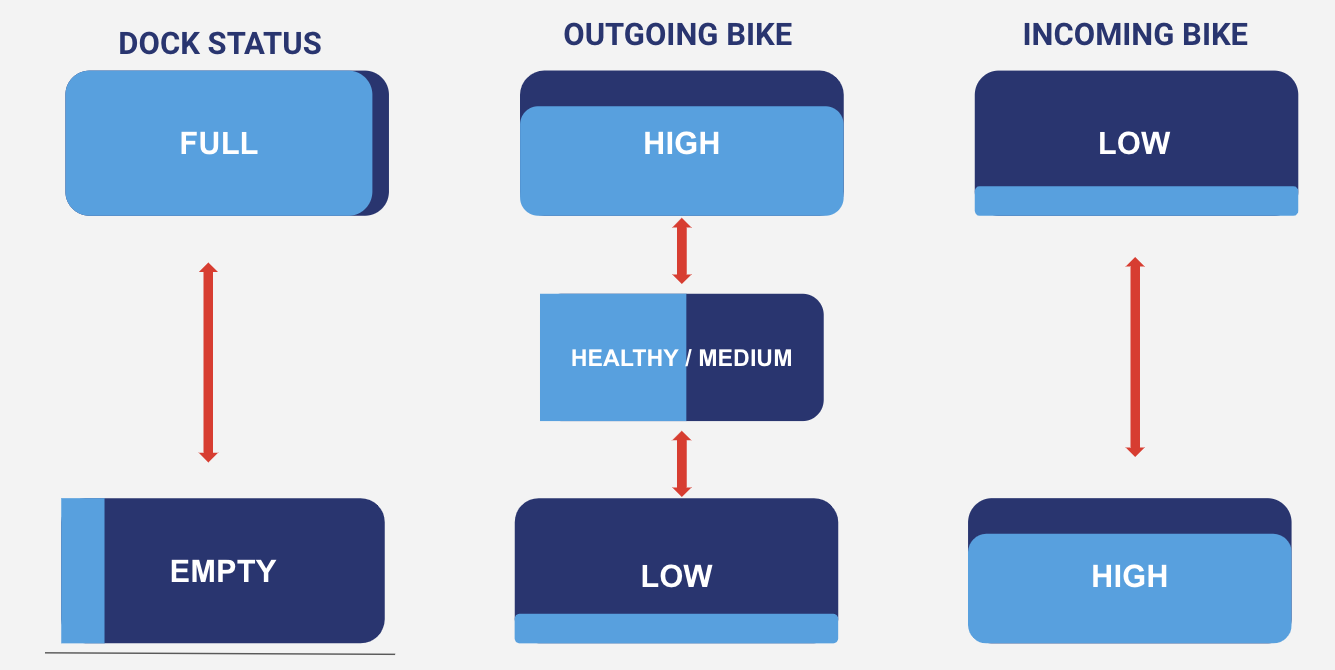
Any stations that our model identified as full dock status as well as having a high outgoing bike demand and low incoming bike demand were classified as in need of having bikes rebalanced out. On the other hand, any stations that our model identified as empty dock status as well low outgoing bike demand and high incoming bike demand were classified as in need of having bikes rebalanced in.
Stations that were identified as in need of having bikes brought in were paired with stations identified as in need of having bikes taken out based on the Manhattan's distance were paired together. Once these stations were paired, their dock statuses were updated in the master table and they were removed from the list of stations to be rebalanced, in order to avoid double counting. Finally, the algorithm then outputs the results of the paired list using individual dock station id numbers as identifiers.
Conclusion
For a more detailed version of this work, please visit our GitHub repository.
About
Let's Talk!
I am a detail-oriented data analyst with experiences in product design and data visualization, proficient in Python, R, SQL, and Tableau. I am also a motivated team player with the ability to systematically approach real-world challenges and provide data-driven business insights.