Understanding Google Online Merchanidse Store's Performance through Web Analytics
By Daniel Choy Dec 2020
As part of a R Shiny Project where I created and launched an interactive R Shiny web dashboard to visualize Google Merchandise Store’s performance by analyzing web traffic and seasonality patterns
Introduction
It is possible that you didn't know about it, but Google has an official online merchandise store where they sell their branded products and those of their other popular brands such as Android, YouTube, and so on – something that I wasn't aware of until now.
What came as a bolt from the blue is that I had access to Google Online Merch Store data for web analytics through Google's BigQuery. So, I wanted to look into Google Merch Store's performance as an e-commerce website by tracking important data. By doing this, the Google Merchandise Store analytics team can decide upon its business objectives, such as: what is it that makes money? It could be sales, direct sales, developing leads for sales, or page views. Once a business objective is set, goals can be decided such as conversions, leading to revenue. Another thing that I paid attention to is key performance indicators that indicate trends. They are not a specific goal, but in large part, these are numbers that help us understand the relationship of how many people are coming to the site, what they are looking at, and how they may contribute to people meeting our goal.
About the Data

This project primarily consists of three types of data – traffic data, content data, and transaction data queried from BigQuery.
Traffic data includes information about where online merchandise store users originate and how they interact with the website. By analyzing traffic data, we can track traffic patterns and visitor behaviors to measure the Google Merch store website's effectiveness, combined with the overall digital presence. If data are available, we can answer questions like: where are the website visitors located? Which marketing channels are driving the most traffic to the website? What are the most popular pages on the website?
Content data includes information about the behavior of the users on the website. These include URLs of pages that users look at, how users interact with the page contents through bounce rats, hit numbers, and time spent on the website.
Transaction data has information about the transactions that occur, including transaction numbers, prices of the products, etc.
Unfortunately, because the available data was a demo version provided by BigQuery, I was only able to query data from August 2016 to July 2017, which resulted in a total of 901,097 visits and 12,070 transactions.
Google Merchandise Store Performance
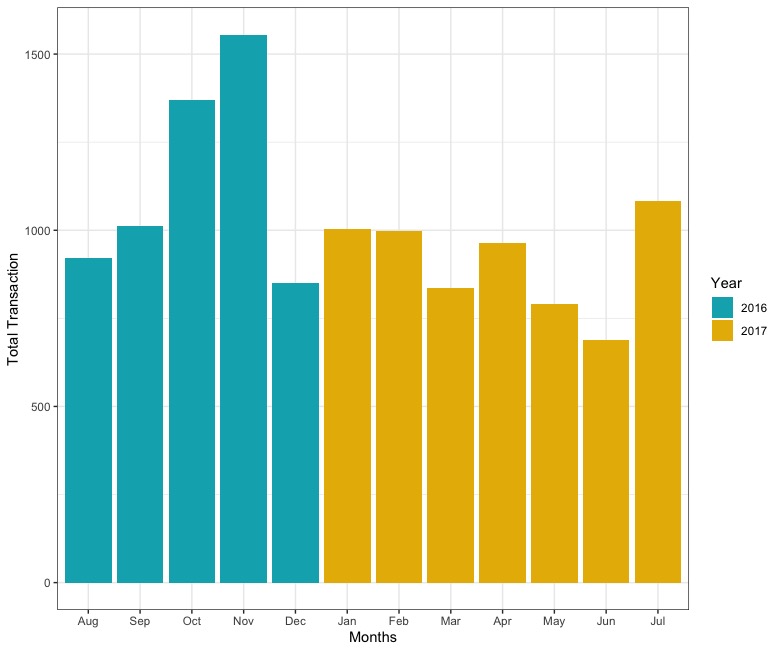
Google Merchandise Store Transaction Number by Months
So how well is Google Merchandise Store performing in terms of transaction numbers and revenue? Based on the graph above, from August 2016 to July 2017, October and November in 2016 are the busiest months in terms of transaction numbers. November, in particular, has 50% more transaction numbers than any other month. This pattern might be due to several reasons: A seasonality matter or only a factor of randomness. Unfortunately, we do not have access to the store's previous data to figure it out. However, suppose previous years indicate a similar pattern. In that case, we can argue that Google Merchandise Store is particularly busy during October and November, given that Google Merchandise Store is offering its products without any promotions or extra ads.
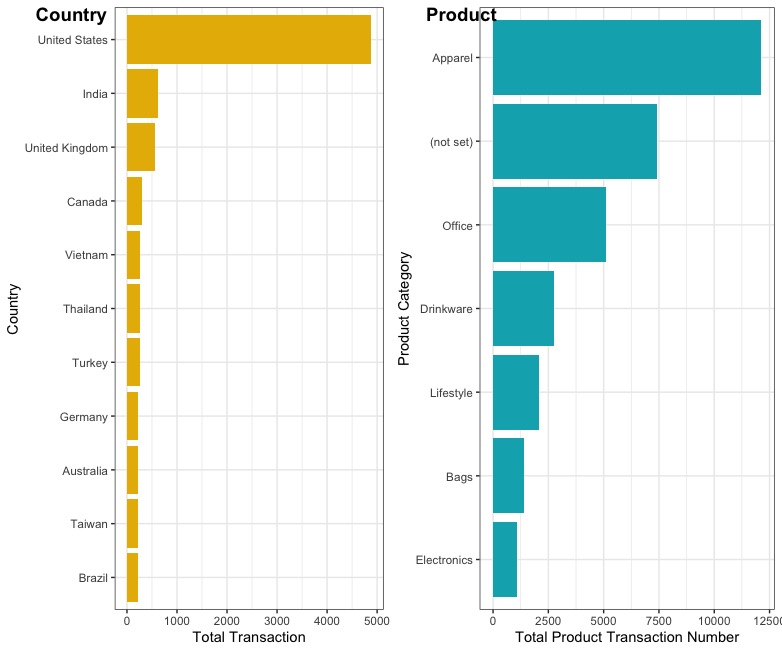
Next, I observed the transaction number by country, and Google Merchandise Store's consumers are mostly from the United States. Hence, as of July 2017, we can argue that the United States is the biggest market for Google Merchandise Store. In other words, there are many opportunities and markets available for Google Merchandise Store to expand – countries like India and the United Kingdom could be an opportunity for Google Merchandise Store to expand if the e-commerce website wants to grow. In terms of products by category, apparel was the most popular merchandised product that the consumers were purchasing.
Based on the overview of Google Online Merchandise Store's performance, what are some key takeaways and insights?
One, based on the given data, Google Merchandise Store can use October / November as an opportunity to reach out to a broader audience. During this timeframe, based on the store's objective, the website can set up different strategies. For example, if the store wants to attract more consumers, it can provide invitational promo codes or coupons. If the store wants to put out an ad related to Google Brands, this could be the chance to put out more ads on its website. If the e-commerce website wants to increase its already high revenue and transaction number for the particular month, the store can put out more promo codes to spend. Also, strategic planning for the supply chain is a must during a busy period.
Web Analytics
As we get into some more in-depth analysis with analytics, we will now be looking at some primary acquisition, behavior, and conversion tools.
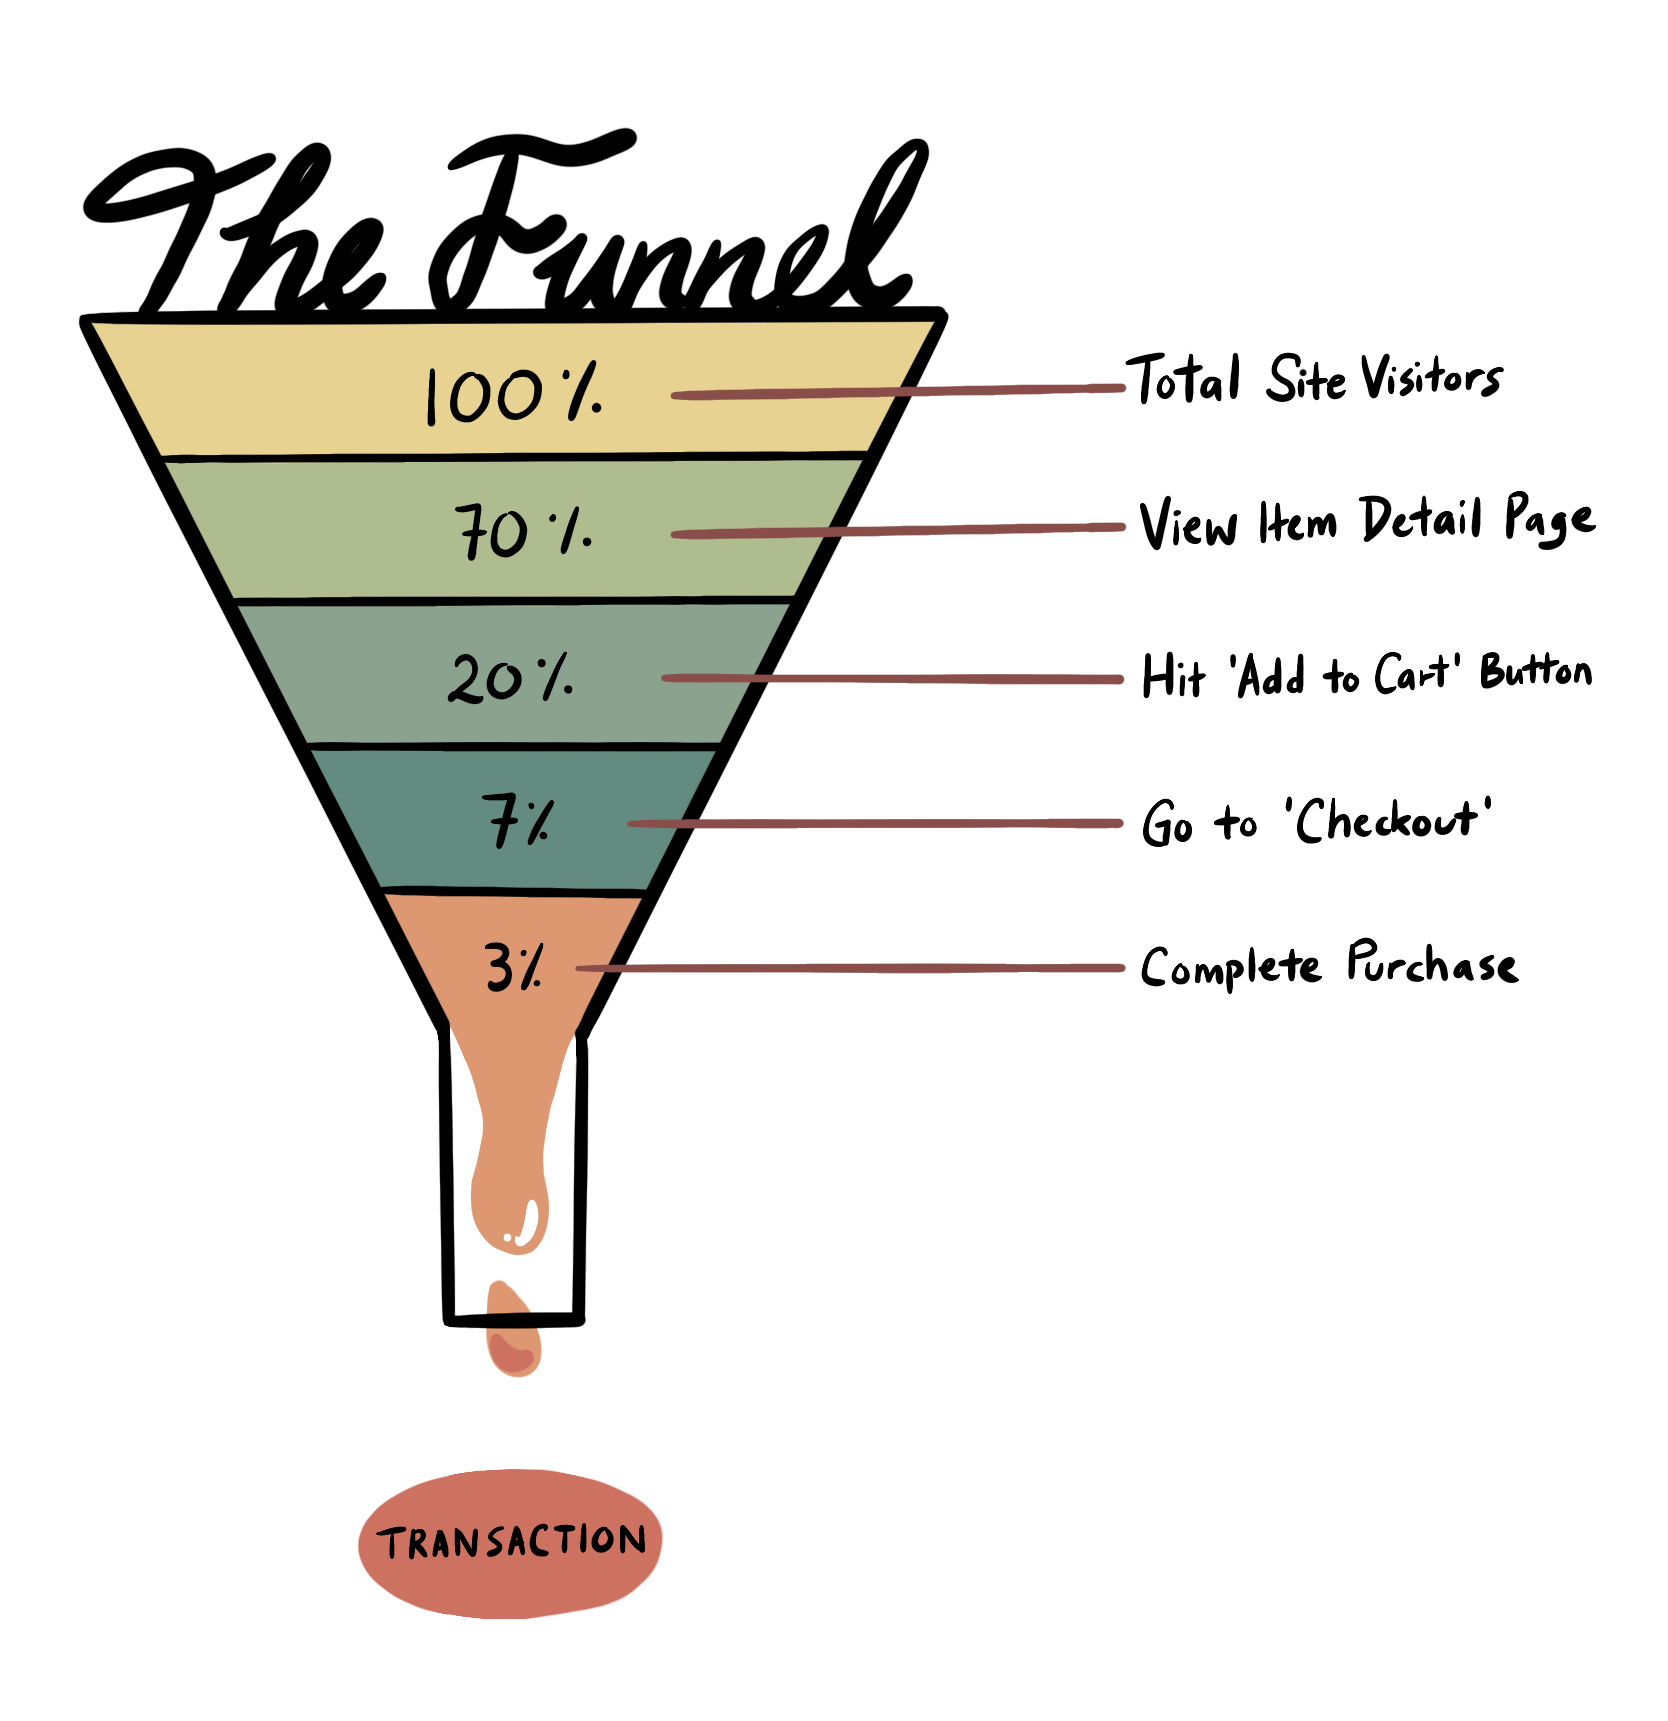
One way to understand how consumers (or users) interact with the website is to conduct a funnel analysis. Looking at an e-commerce website through a funnel is essential to set goals and prioritization, decide success metrics, and issue diagnosis for the website. An example of a funnel looks like a graph below, which shows how a user first visits the website and completes a purchase at the end.
The idea is simple. One's target user will go through a step-by-step flow until the user makes a transaction, just like a funnel. For example,
1) A user is looking for a particular product and happens to find your website thanks to Google Ad.
2) A user lands on your home page, and your user is satisfied with the result and decides to look around.
3) A user finds a satisfying product and clicks on 'add to cart.'
4) A user clicks to check out.
5) A user enters their personal information and finalizes the transaction.
At each step, a certain percentage of people might drop out of the funnel. Knowing such a rate or knowing when they drop out can help you determine where your website lacks and understand your users' psychology.
For the case in Googler Merchandise Store, I looked at a particular time period – the entire month of November in 2016. During November, there were a total of 141,792 unique user visits and a total of 2811 distinct transactions. In other words, only approximately 2% completed a purchase among the total visitors. Given that our objective is to increase our conversion rate and grow our revenue, we want to understand where our customers are exiting from the website.
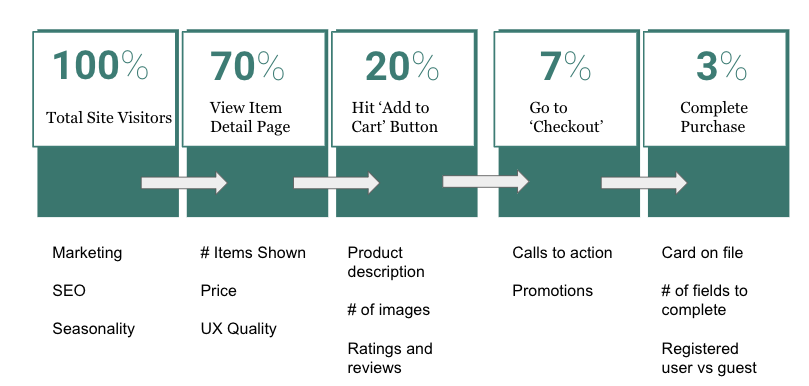
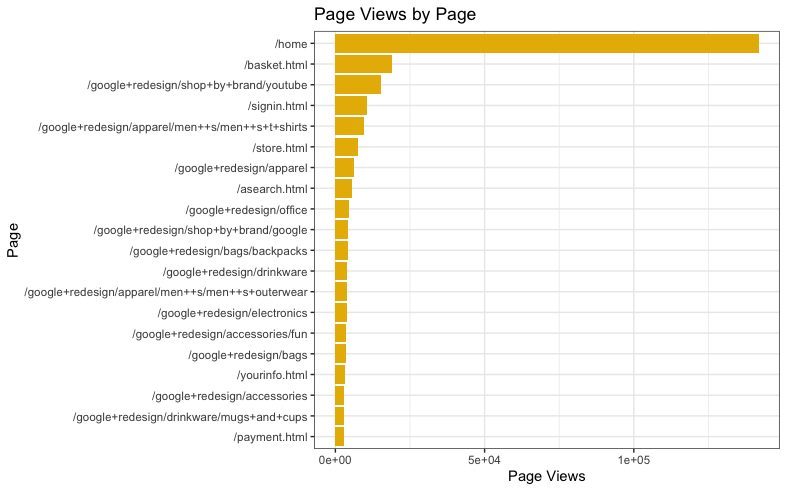
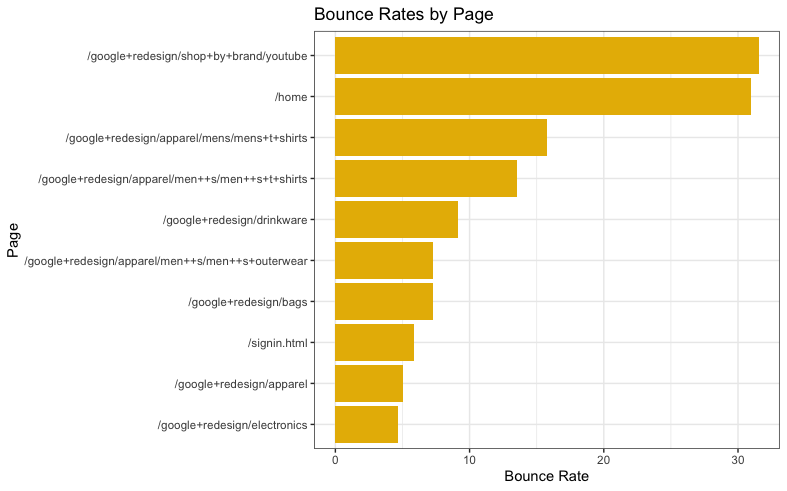
Unfortunately, BigQuery’s demo version doesn't provide all the necessary data to analyze each steps of the funnel. However, given the data and the graph above, we can already understand that a lot of our customers lost interest in moving forward at the home page based on the high bounce rate. There are several reasons why people might bounce – the content might not match the user’s expectation, the design might not work, purpose of the page might not be clear, or the page is not presented clearly. Therefore, in order to improve the website’s bounce rate or to improve Google Merch Store’s conversion rate, we need to either improve the website to enhance the user experience and satisfy user’s expectation or improve Google Merch Store’s conversion rate based on each step. For example, if we look at the graph above, if Google wants more visitors to visit merch website, the website can invest in marketing or improve SEO. If the e-commerce wants more of its visitors to view item detail page, the website can improve its user experience quality. .
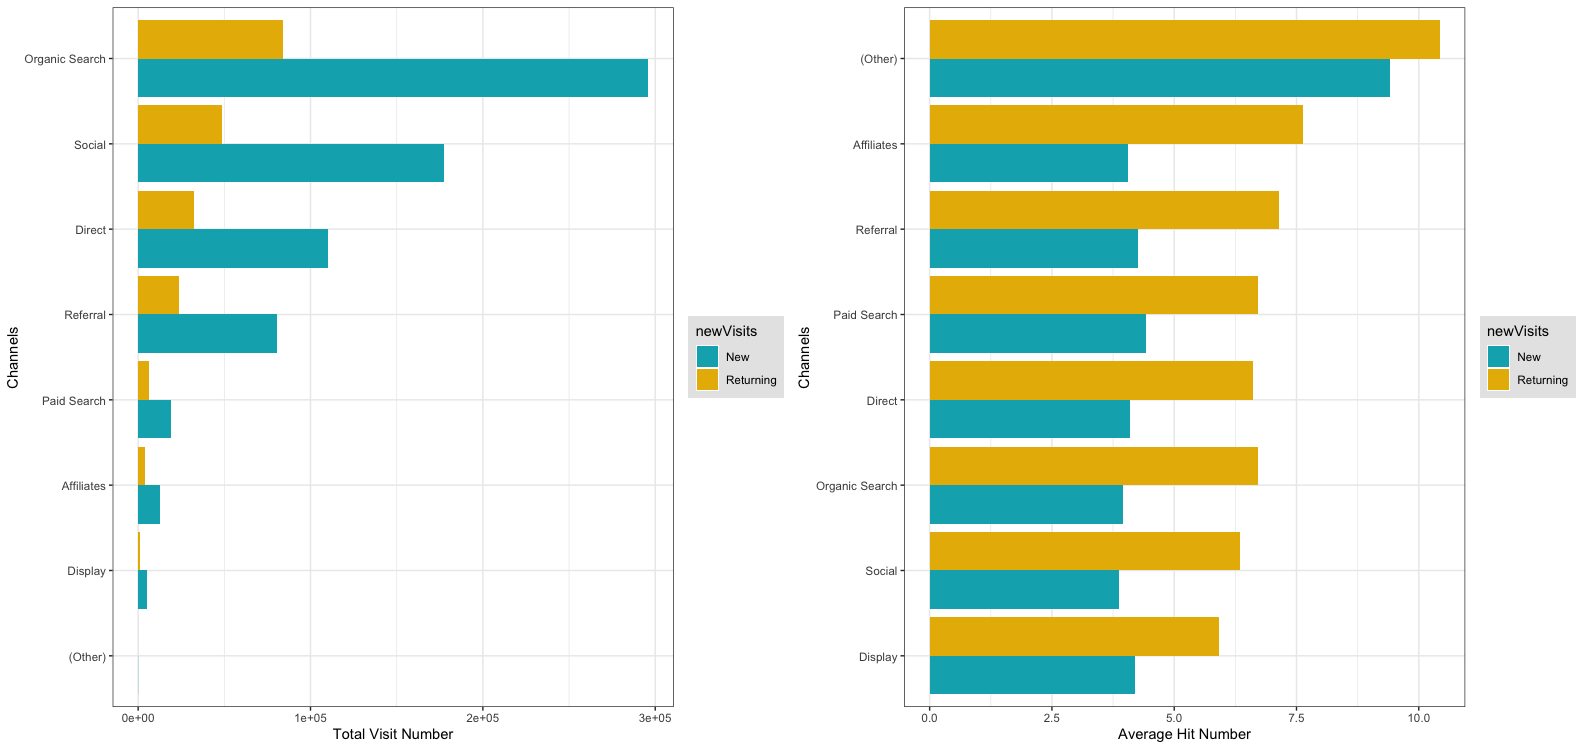
Another way to analyze traffic patterns and user behavior is to look at specific variables and metrics. For instance, we can look at the traffic channel that shows whether a user is coming from organic search, referral, social, direct, or paid search. Based on the graph above, Google Merchandise Store is visited mostly via organic search. In other words, users visiting Google Merch Store have a particular intent; hence, if the website provides a satisfying experience and solution, these users are more likely to convert.
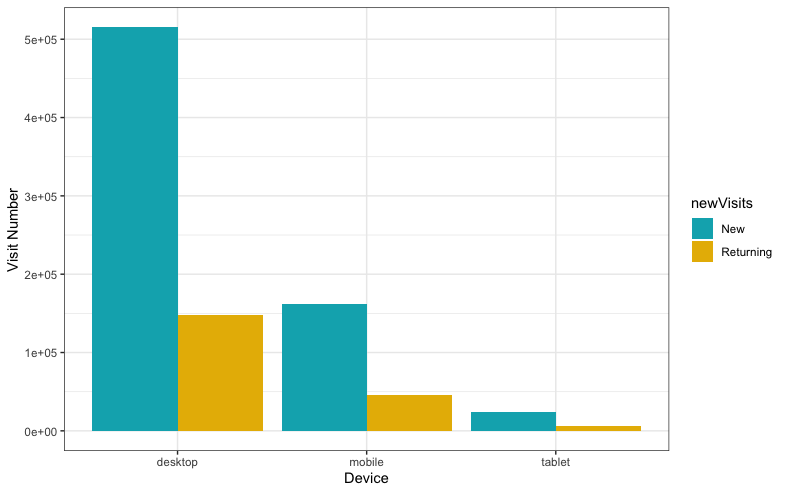
Next, if we look at the number of devices, most of our users use desktops to access the merchandise store mainly because Google Merchandise store doesn't have any apps available. However, given the importance of mobile devices in the e-commerce scene, it is crucial to expand different devices for users.
Next, if we look at the number of devices, most of our users use desktops to access the store mainly because Google Merchandise store doesn't have any apps available. However, given the importance of mobile devices in the e-commerce scene, it is crucial to expand different devices for users.
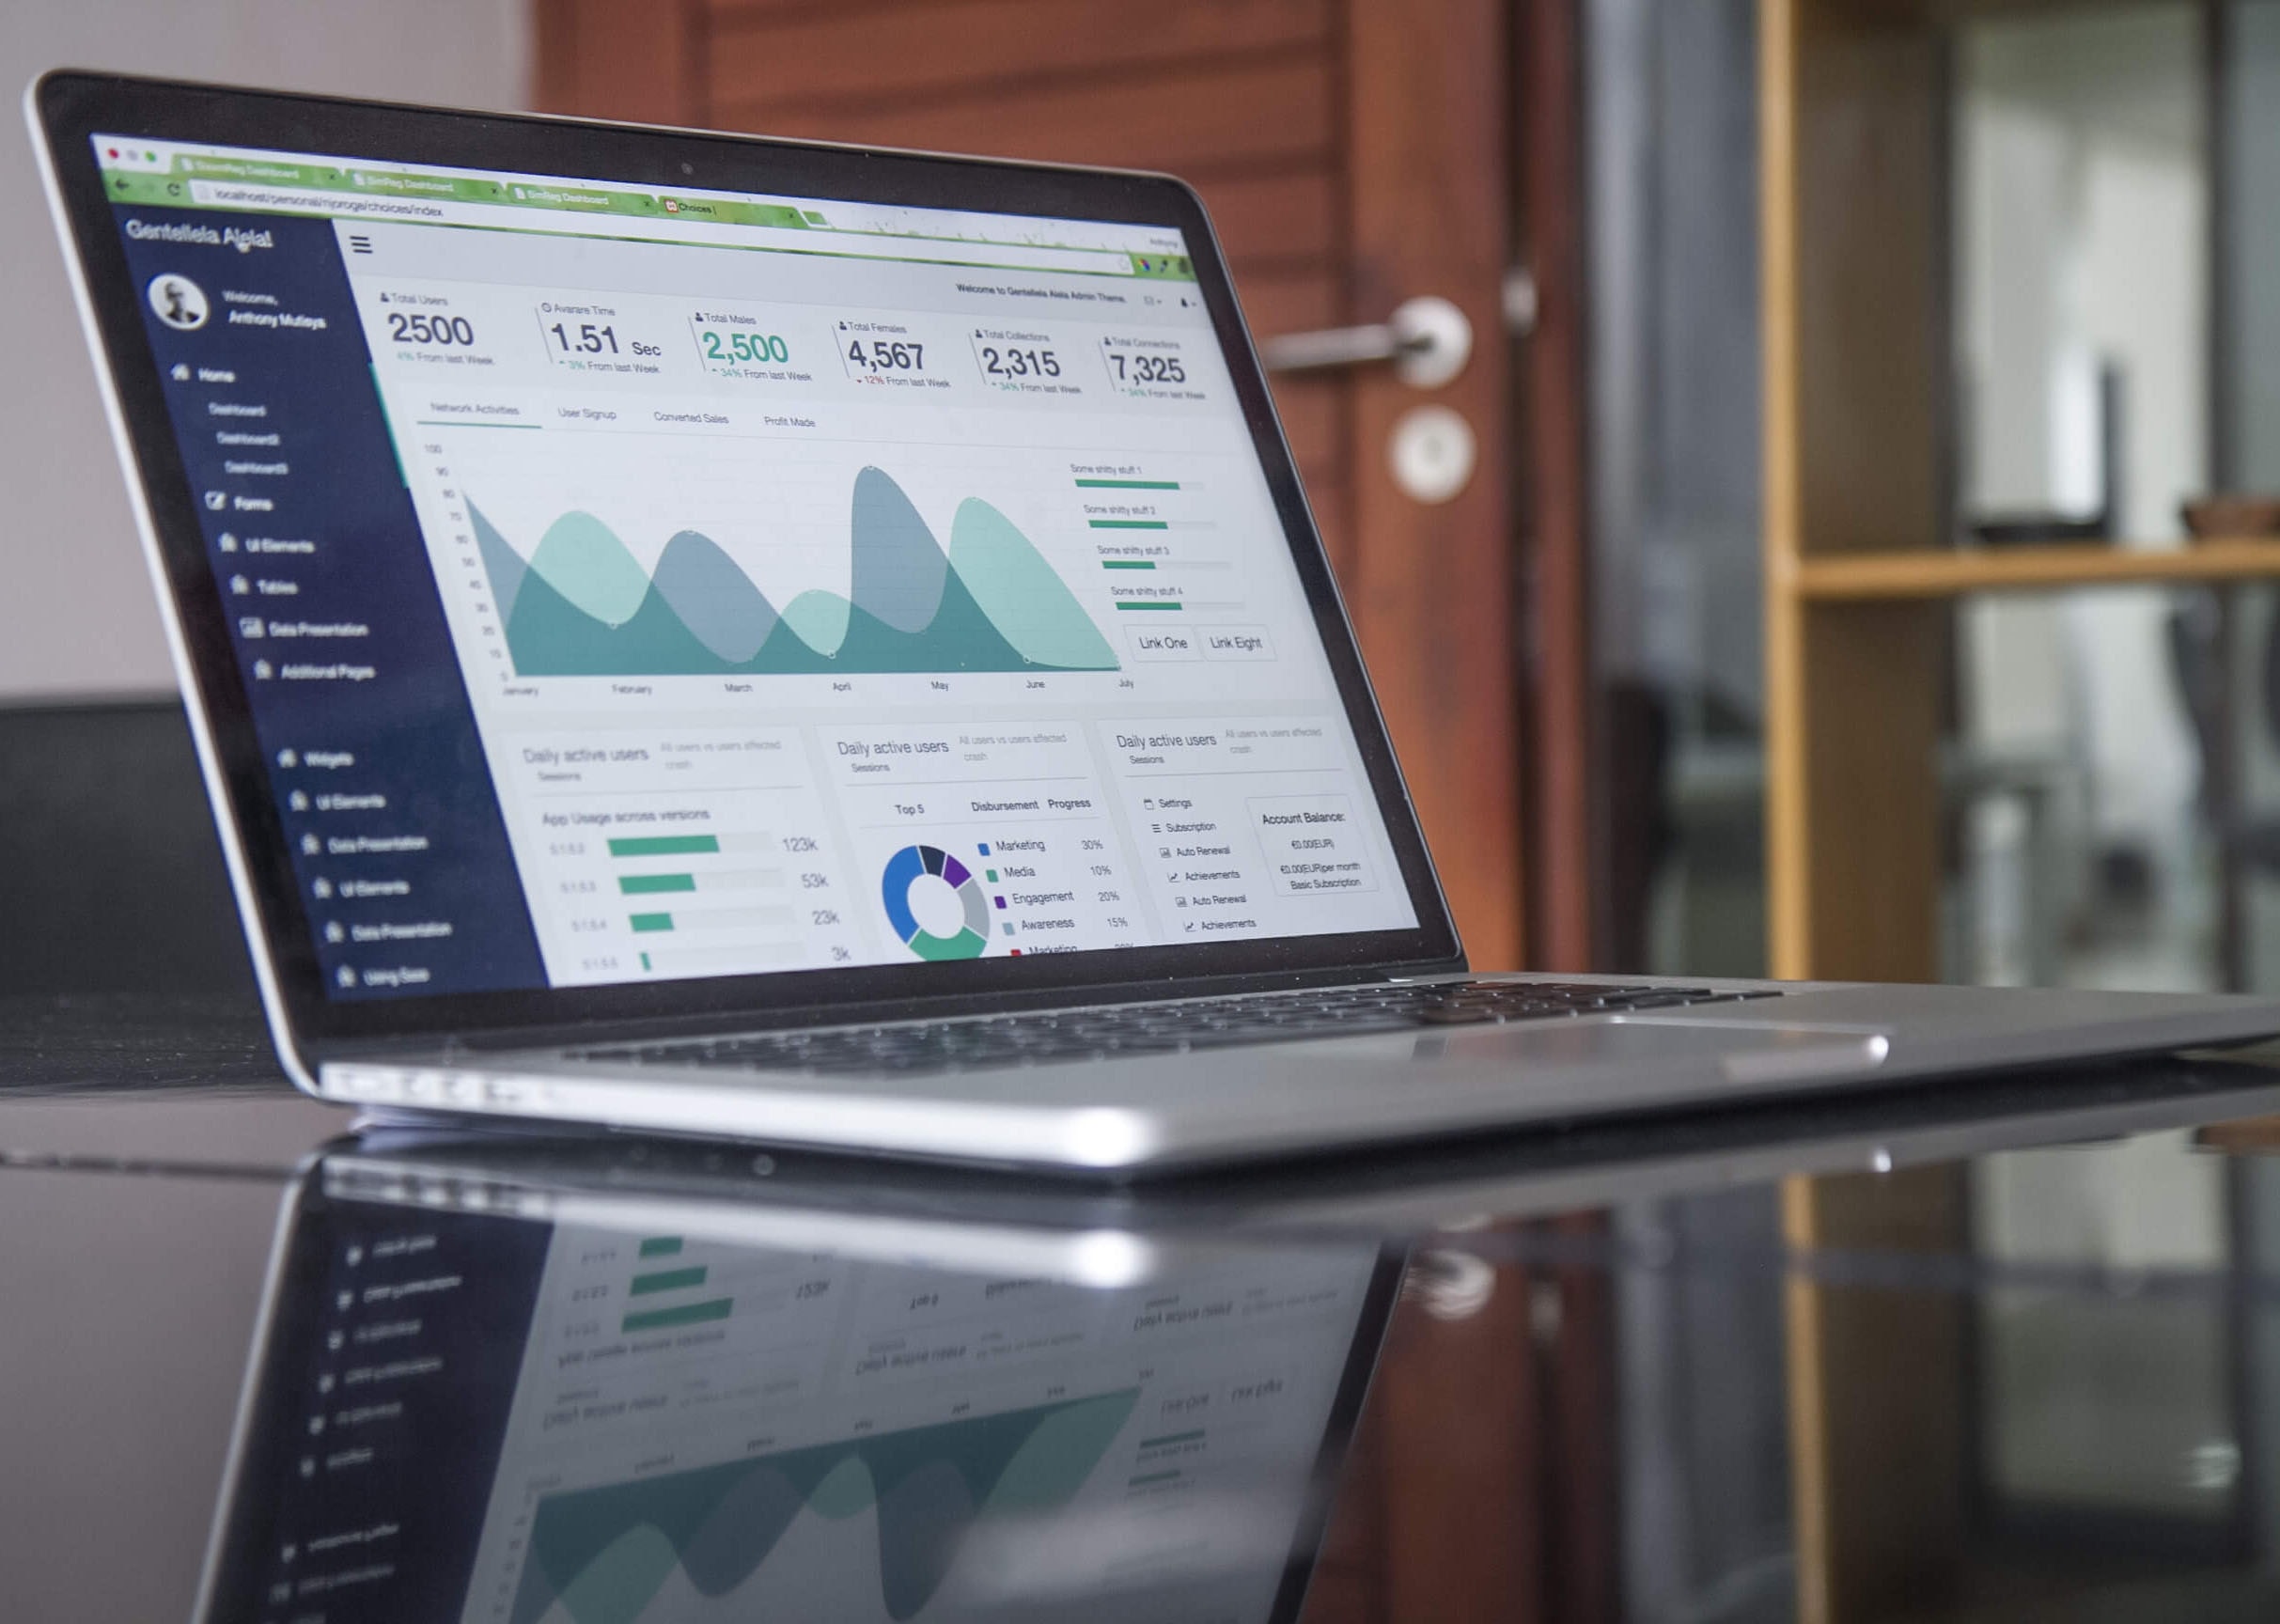
R Interactive Dashboard
The following R Shiny dashboard is built by Shiny, HTML, and CSS – an interactive web page to track Google Merchandise Store’s performance. Please visit my GitHub repository to launch the interactive dashboard.
Limits
Unfortunately, many important variables were either missing or were difficult to access.
About
Let's Talk!
I am a detail-oriented data analyst with experiences in product design and data visualization, proficient in Python, R, SQL, and Tableau. I am also a motivated team player with the ability to systematically approach real-world challenges and provide data-driven business insights.